Features
This chapter as a clean, readable HTML page.
The “Features” chapter of the Operating Manual, reproduced as a real HTML page. Anything unclear? Open the original PDF of just this chapter (pages 170-238) (also pinned top-left). Hub: all chapters.
Microphone Settings
You can install an external microphone on the beacon and enable it in the dashboard. Check more about the external microphones in this chapter.
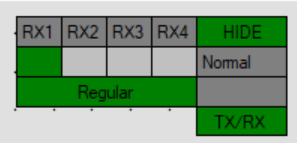 Below are presented settings for a default microphone, aka the only internal beacon microphone.
To turn on/off a specific mic, press the gray box above
To change mode press on the bottom bar
Specific Marvelmind Devices
Below are presented the microphone settings for different Marvelmind devices:
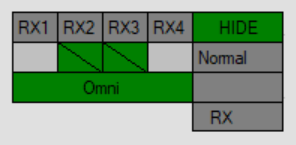 Badge:
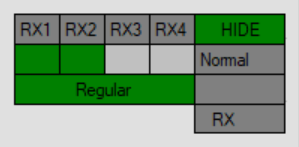 Jacket:
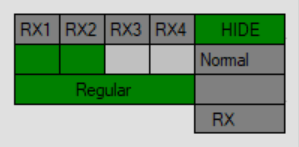 Helmet:
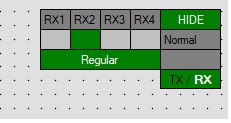
Separate Omni-Microphone
 You can additionally purchase an Omni-Microphone for improved performance.
Before buying, let us know which device you want to use with the Omni-Microphone. Please refer to the microphone physical connection chapter.
On Super-Beacon, the Omni-Microphone works in Omni mode on RX3 and RX4. On Super-Beacon-2, 3, and 4, the Omni-Microphone operates in Omni mode on RX2 and RX3.
- Be careful. You should have soldering skills to solder the Omni-Microphone on the board.
- Settings to select Omni-Microphone:
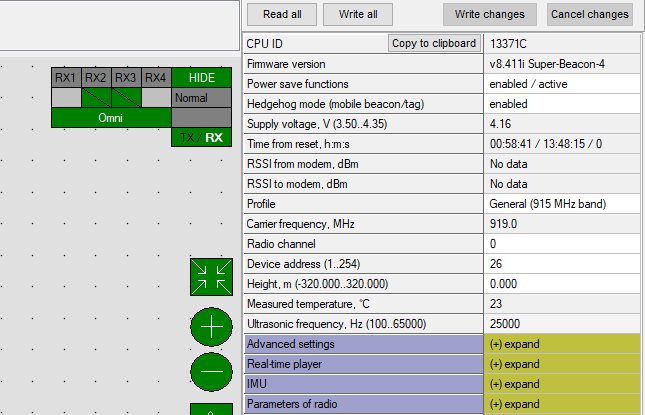
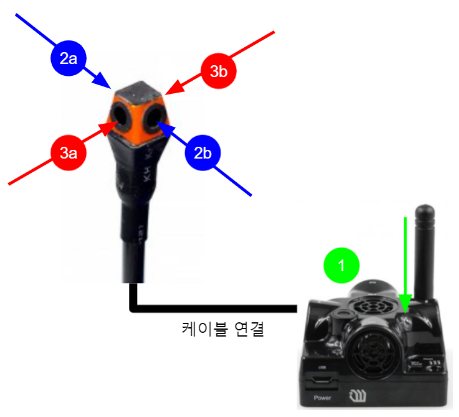
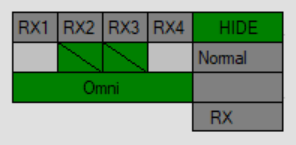 Example of correct settings for Omni-Microphone on Super-Beacon-2, 3, 4 in Omni mode:
Also, if you want to use a specific microphone on the Omni-Microphone, you can switch to Stereo mode and turn on one of the pairs, or even a single mic in a pair.
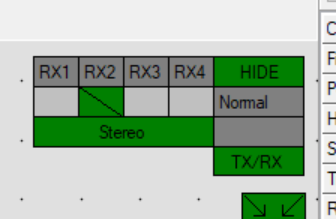 To turn on one of the pairs on Omni-Microphone, click the box labeled RX2…RX4, depending on which Super-Beacon you have and which pair you want to have turned on:
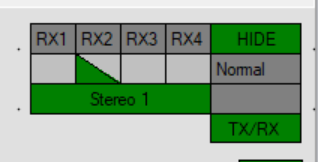 To turn on one of the mics in a specific pair, press on a particular box below RX2…RX4, using the CTRL button:
Restart if Modem is Disconnected
This feature resets the beacon when it loses connection with the modem.
Follow these steps to switch on this feature.
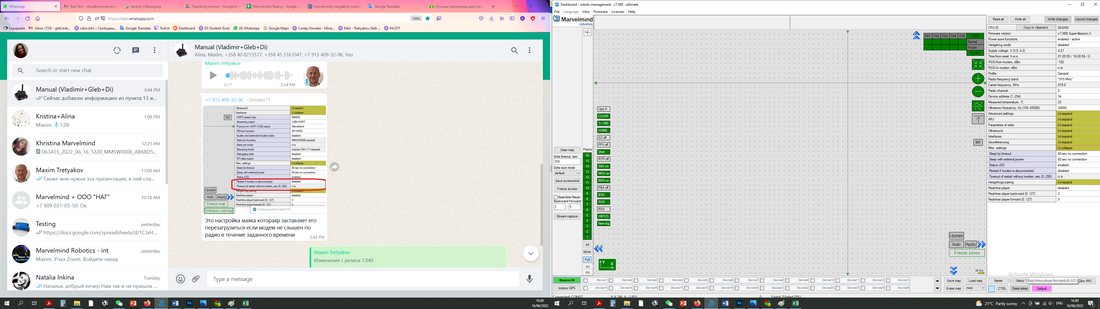 Connect beacon via USB or radio and expand Misc. settings in settings bar:
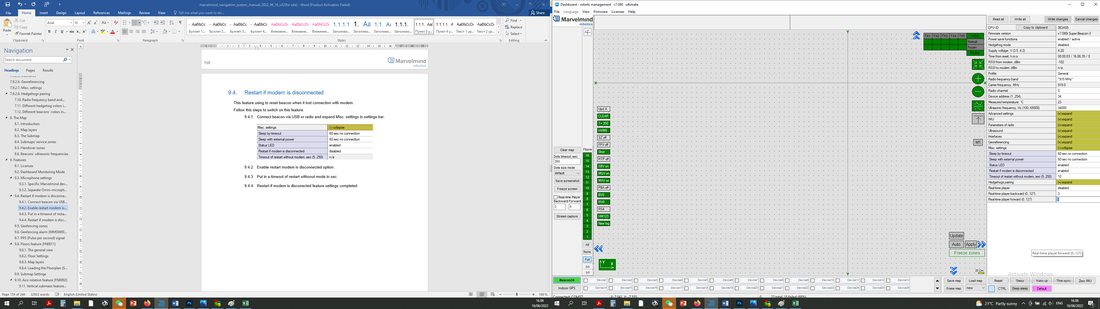 Enable the “Restart if modem is disconnected” option:
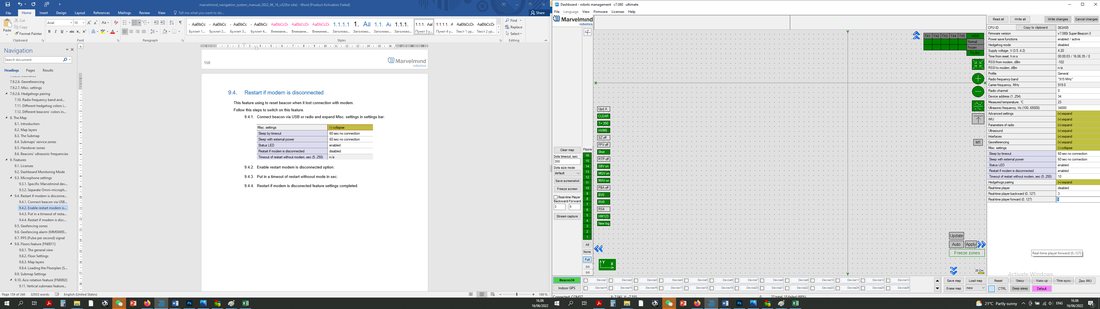 Enter a value for “Timeout of restart without modem” in sec:
The “Restart if modem is disconnected” feature setup is completed.
Geofencing Zones
Geofencing zones are a subset of zones that can be created to prevent people from crossing dangerous zones. Zone violations trigger alarms and are written to a CSV file.
How to create a geofencing zone:
 Unfreeze the map; submap may be frozen
- For a singular geofencing zone, choose a modem in the bottom left corner and use Shift + Left Mouse Button to draw a zone. If you plan to have multiple zones, check the further instructions!
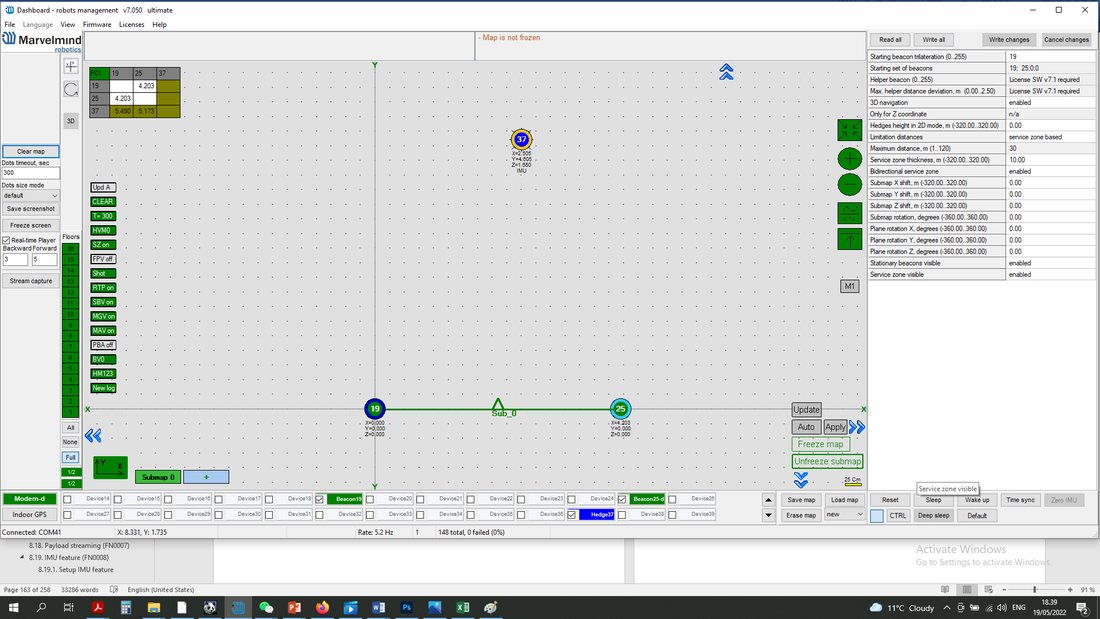 Unfreeze the map; submap may be frozen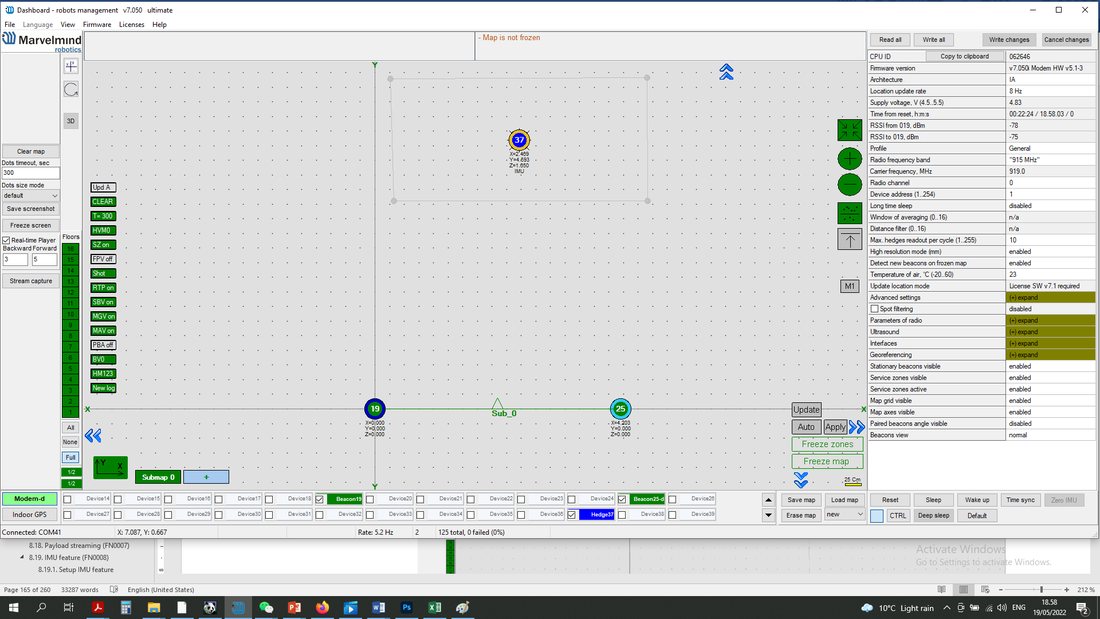
- Right click on the map -> Zones setup
- Left click on Zone type and choose Geofencing
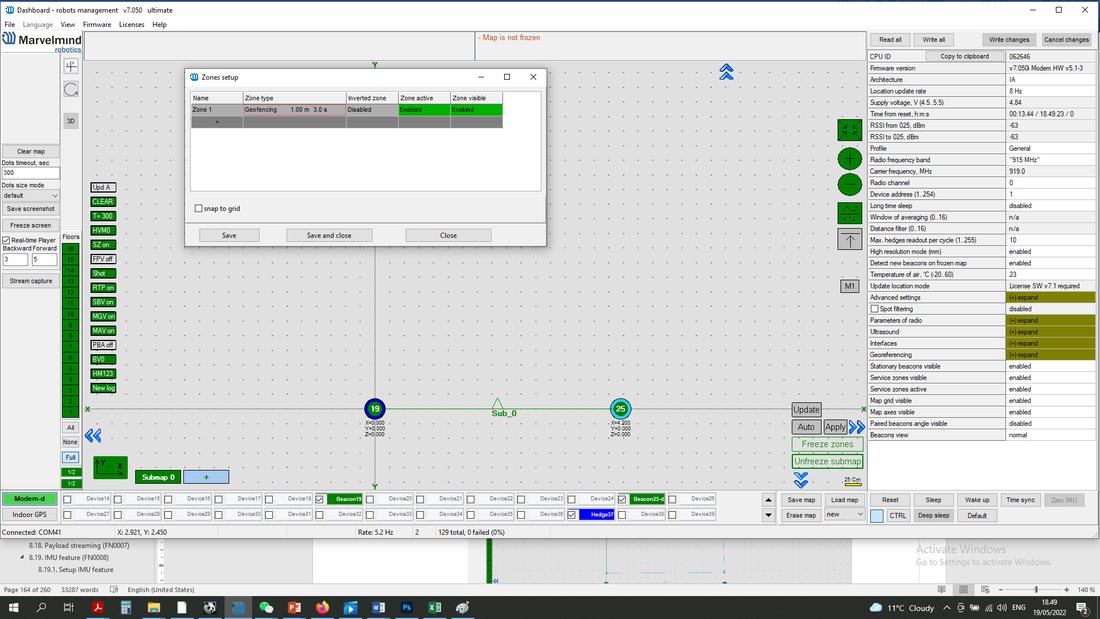
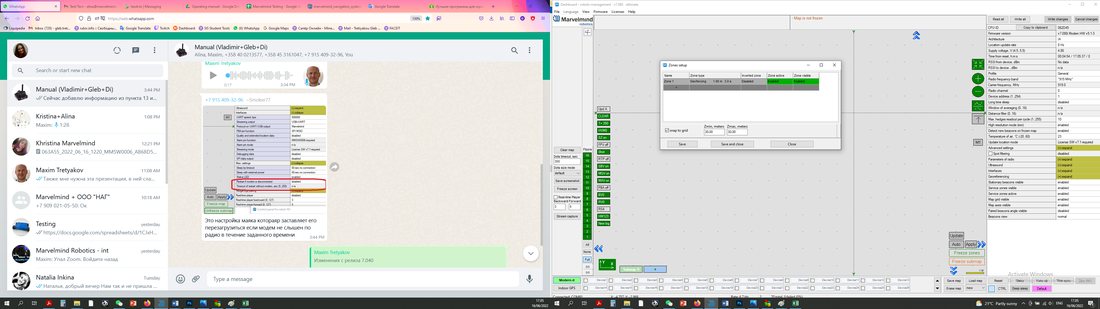
- Create a zone using Shift + Left Click and clicking on the map; click on the point to remove it
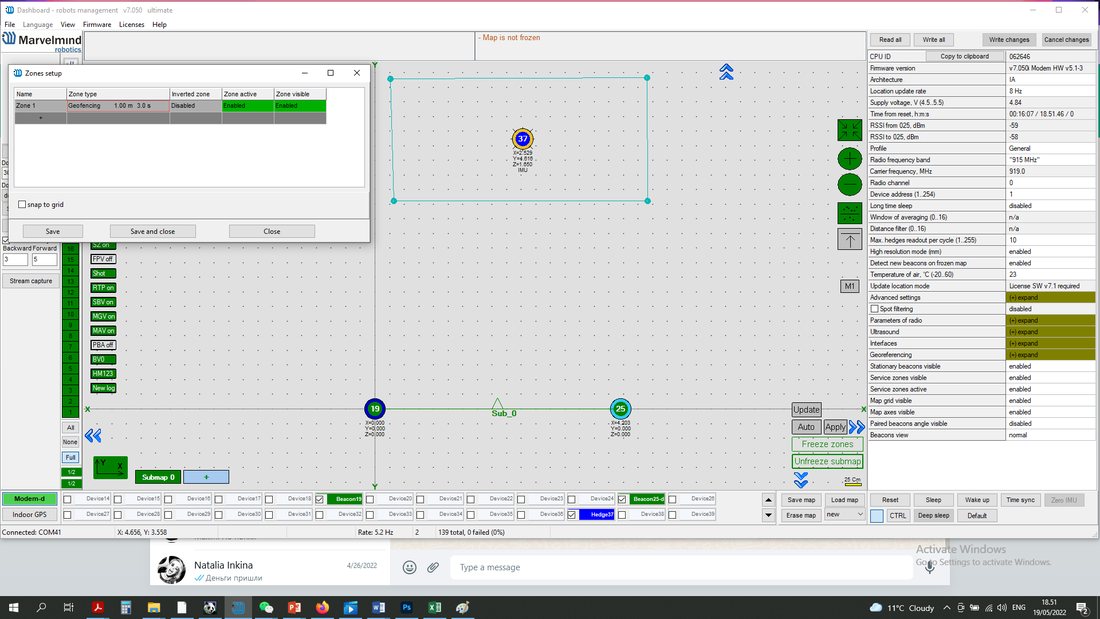
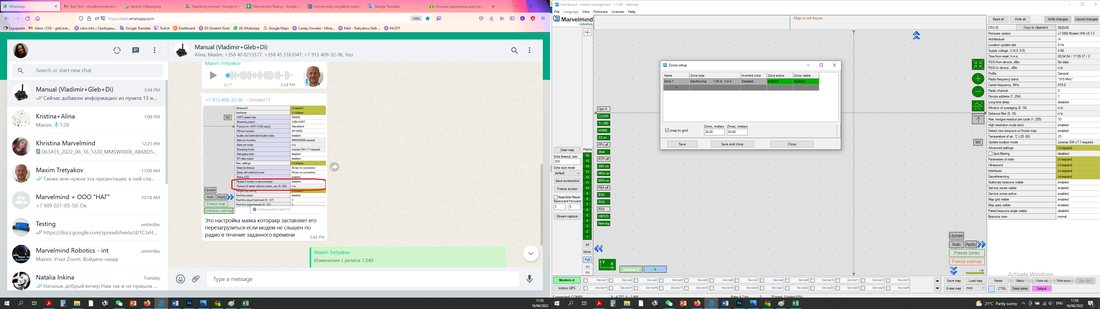
- You can tune the zone by entering the distance and entering time. If the zone is created, press Save and close to save the zone
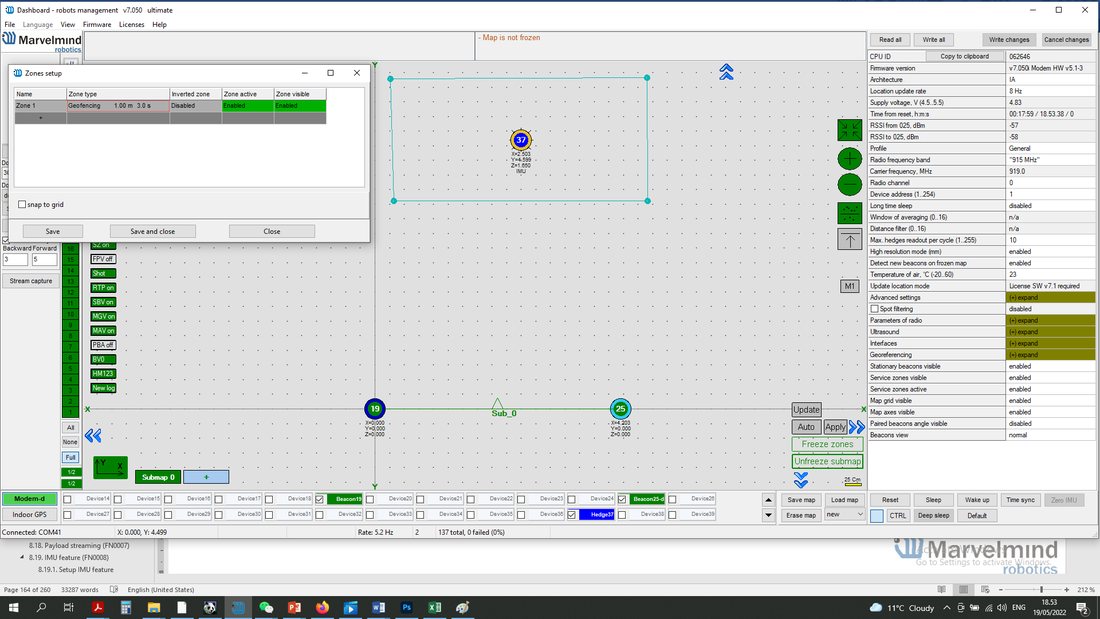
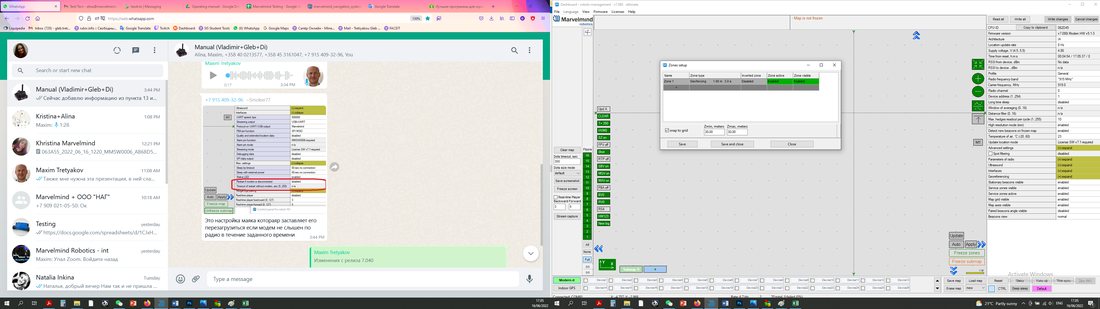
- After you Save and Close the Zones setup window, the zone turns grey. Freeze the map
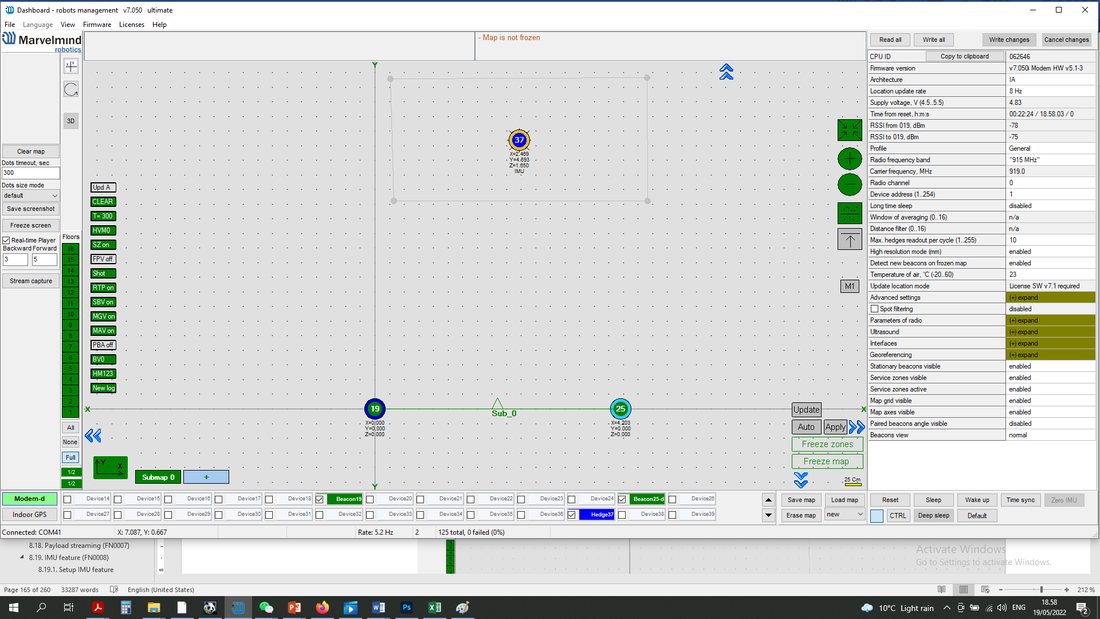
- Zone created and ready to work. If the mobile beacon crosses the zone for a tuned distance and tuned time, that violation will be recorded in a CSV file, and the hedgehog will be colored red in the Dashboard
PPS (Pulse per Second) Signal
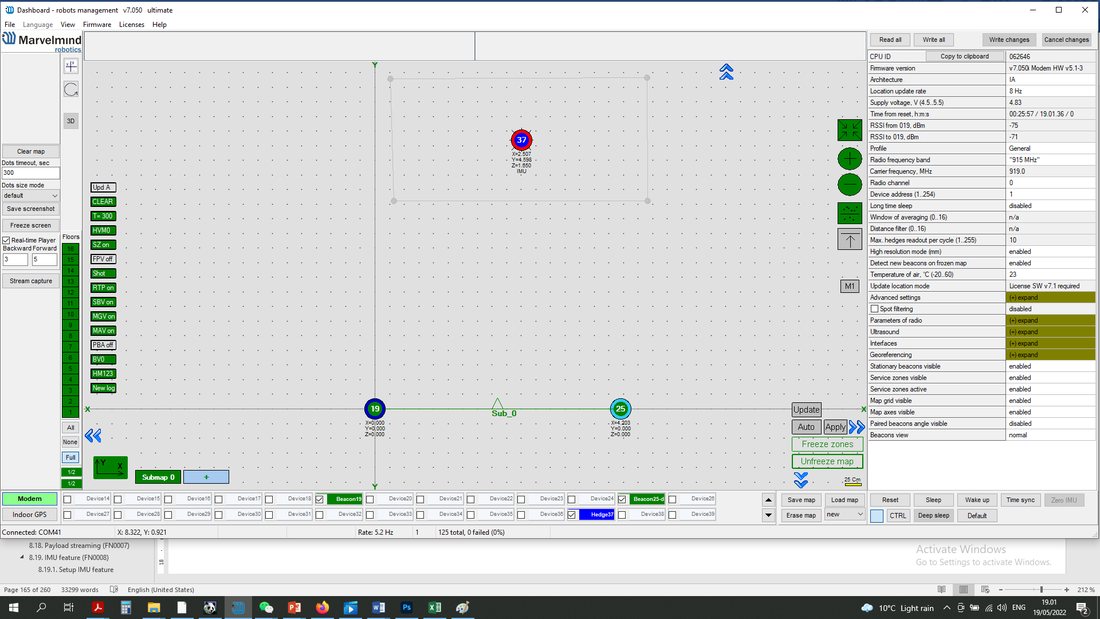 Zone created and ready to work. If the mobile beacon crosses the zone for a tuned distance and tuned time, that violation will be recorded in a CSV file, and the hedgehog will be colored red in the Dashboard
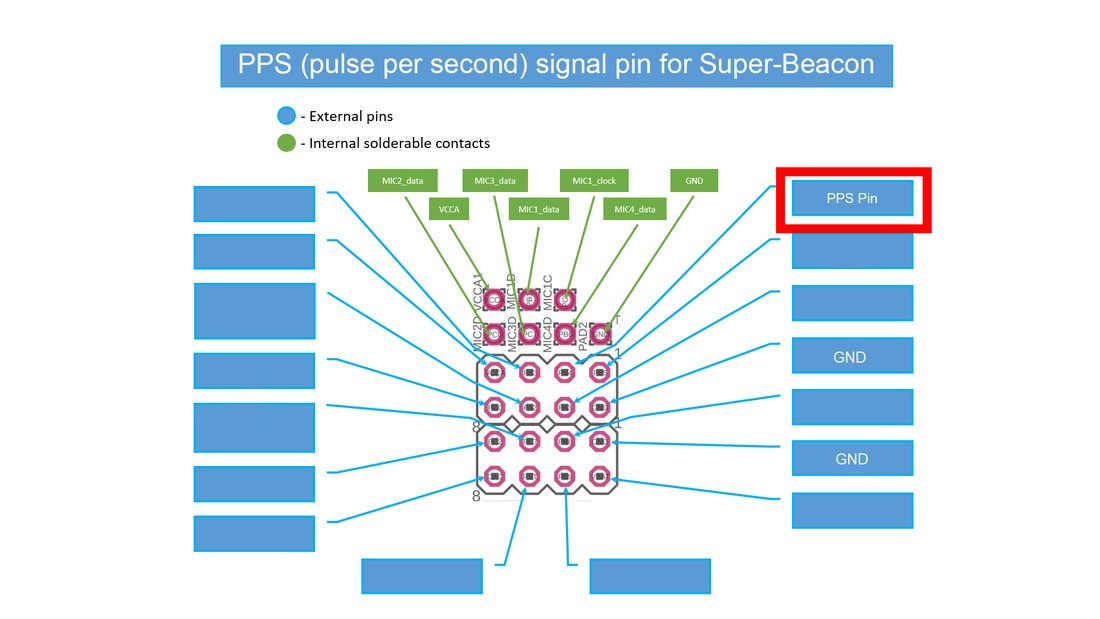
This feature is used to get a pulse signal from Super-Beacon every second. Works with Super-Beacon in NIA only.
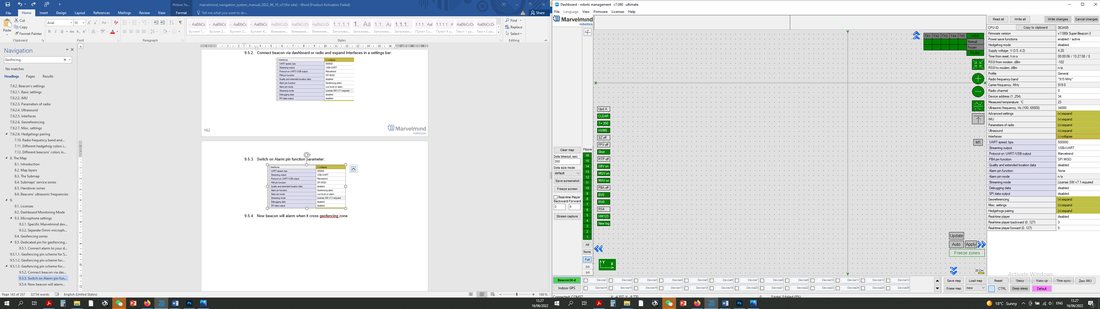 Connect beacon via dashboard or radio and expand Interfaces in a settings bar:
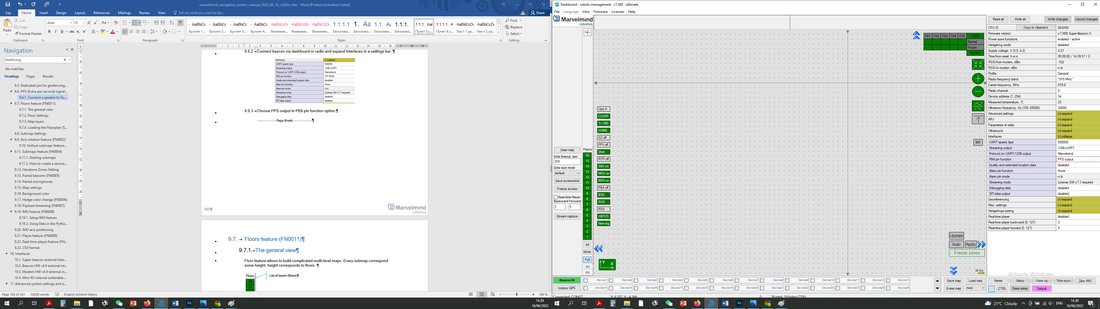
PPS pin settings completed.
Floors Feature The General View
The floor feature allows the building to create complicated multi-level maps. Every submap corresponds to some height, and height corresponds to floors.

Active beacons
Show all objects (even if they are out of floors’ coordinates)
Show no layers (floors)
Show all layers (floors)
List of layers (floors)
Floor Settings
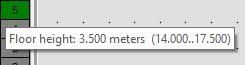 Every floor has its adjustable height and its floor plan
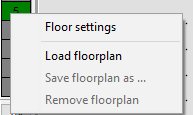 Right-click on the floor area to see an additional menu. There you can change the height of the floor. You can also insert your floorplan for that floor (png, .jpeg, .bmp, .tiff)
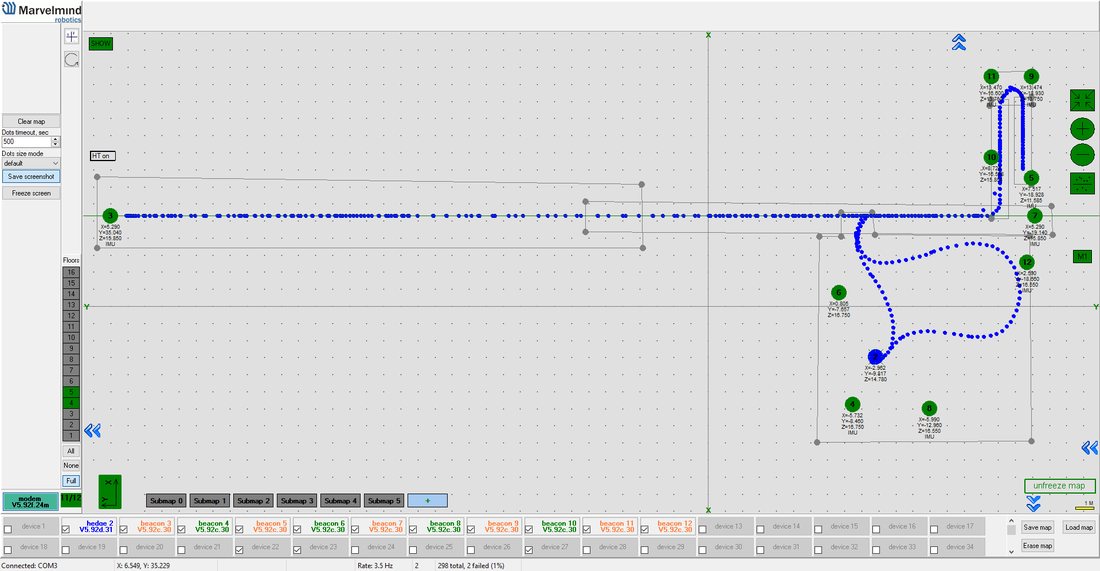 Floors 4 and 5 are enabled:
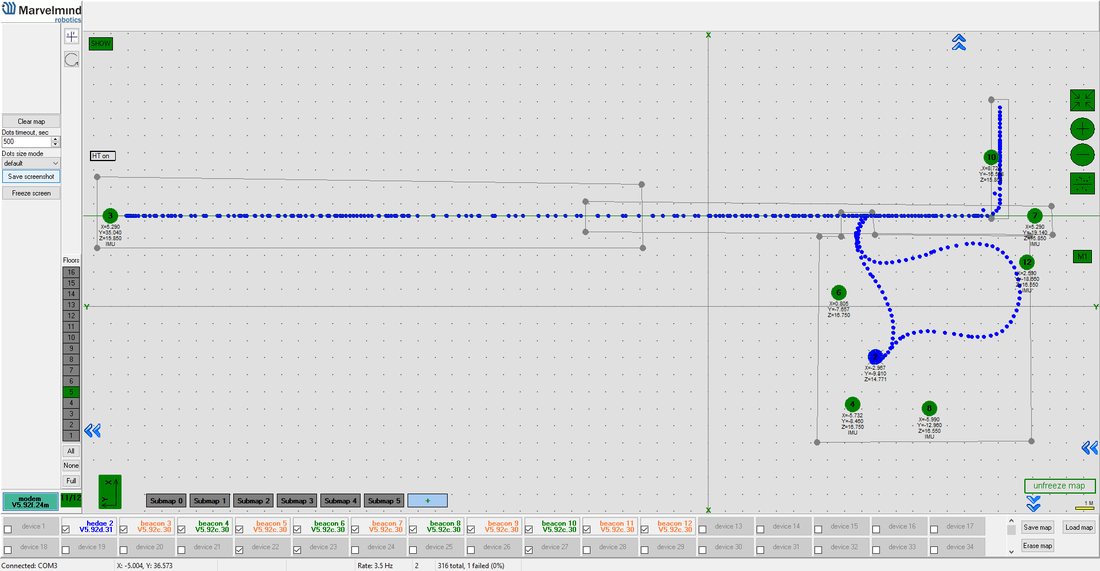 Floor 5 is enabled:
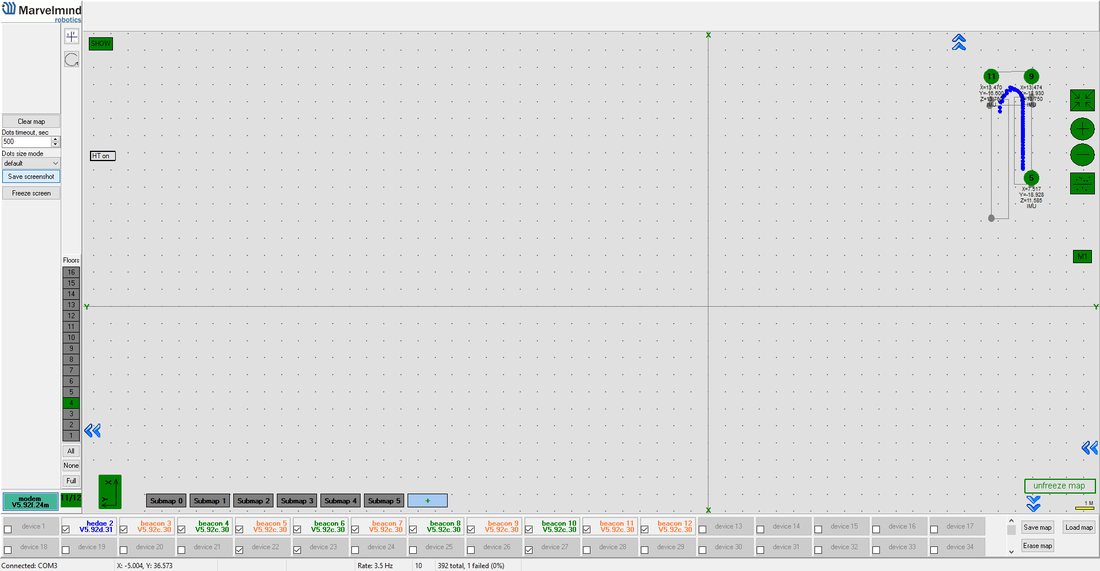 Floor 4 is enabled:
Map Layers
The map consists of several layers. Each layer can be attached to the other.
- Service zones
- Beacons and Submaps
- Floorplan – plan/scheme/picture of a floor where you placed beacons
- Ether – map grid
Floorplan Feature
This chapter describes how to load and use a floorplan in the Dashboard.
Loading the Floorplan (Substrate)
To load a floorplan:
 Right click on a certain floor in the left panel Floors
 Load floorplan -> Choose file (.png, .jpeg, .bmp, .tiff).
  Floorplan is loaded:
Floorplan Scaling
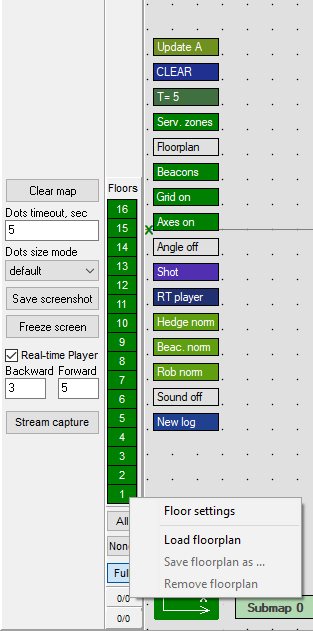 Right click on a certain floor in the left panel Floors
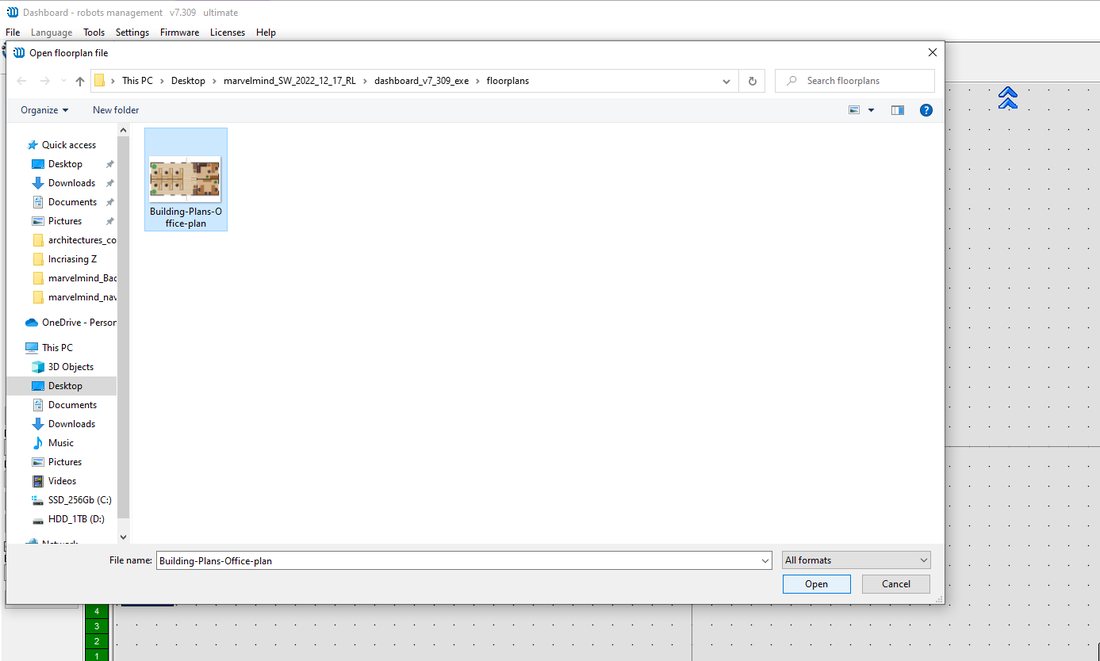 Load floorplan -> Choose file (.png, .jpeg, .bmp, .tiff).
 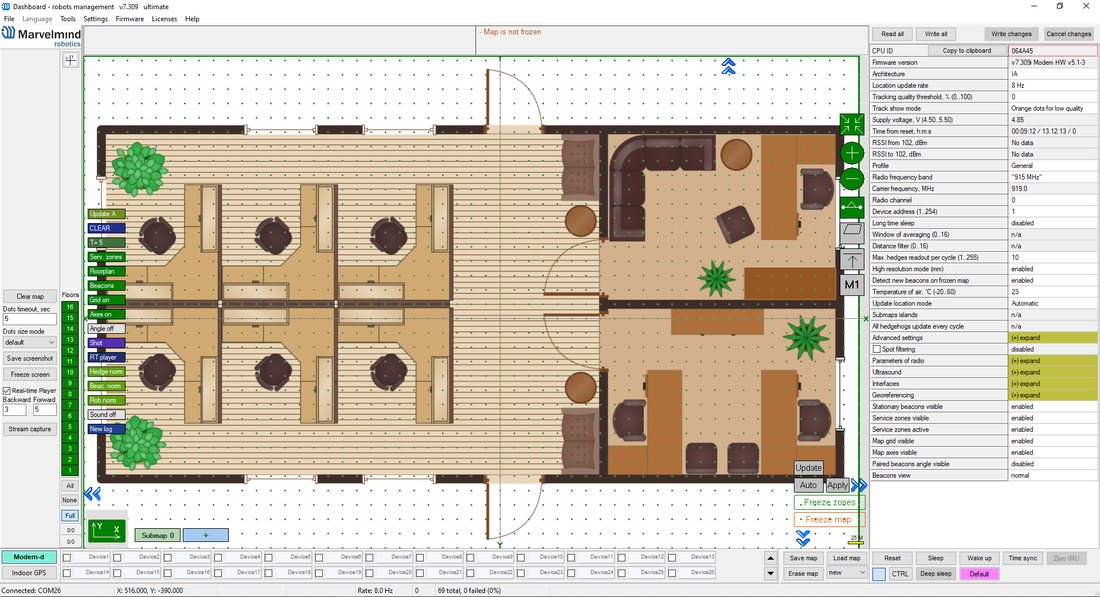 Floorplan is loaded:
The are two ways how to resize a floorplan in Dashboard.
Drag a floorplan from any side of a picture:
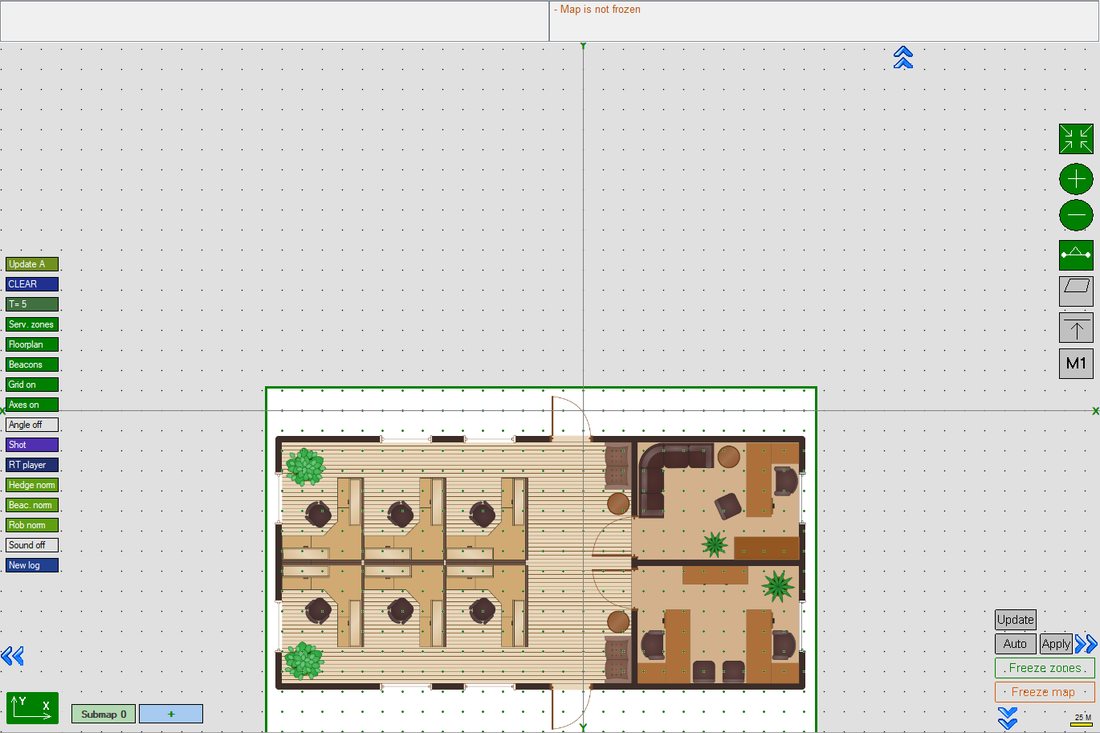
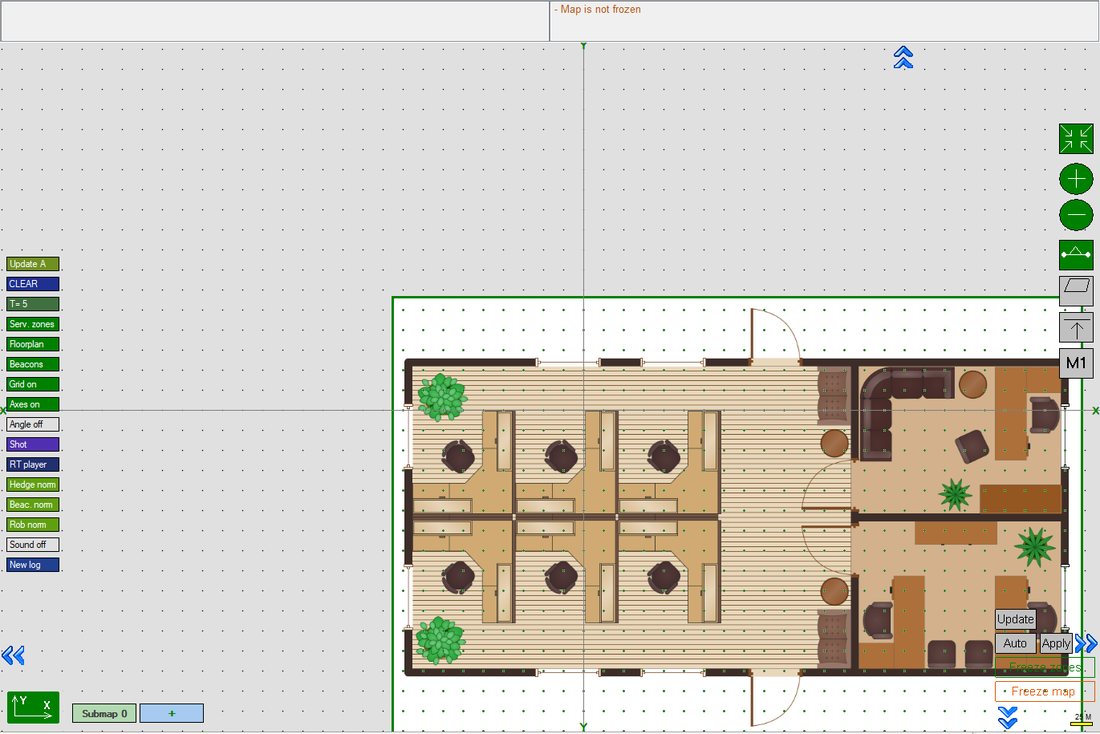 Please note that the plan is scaled evenly, and the image is not deformed:
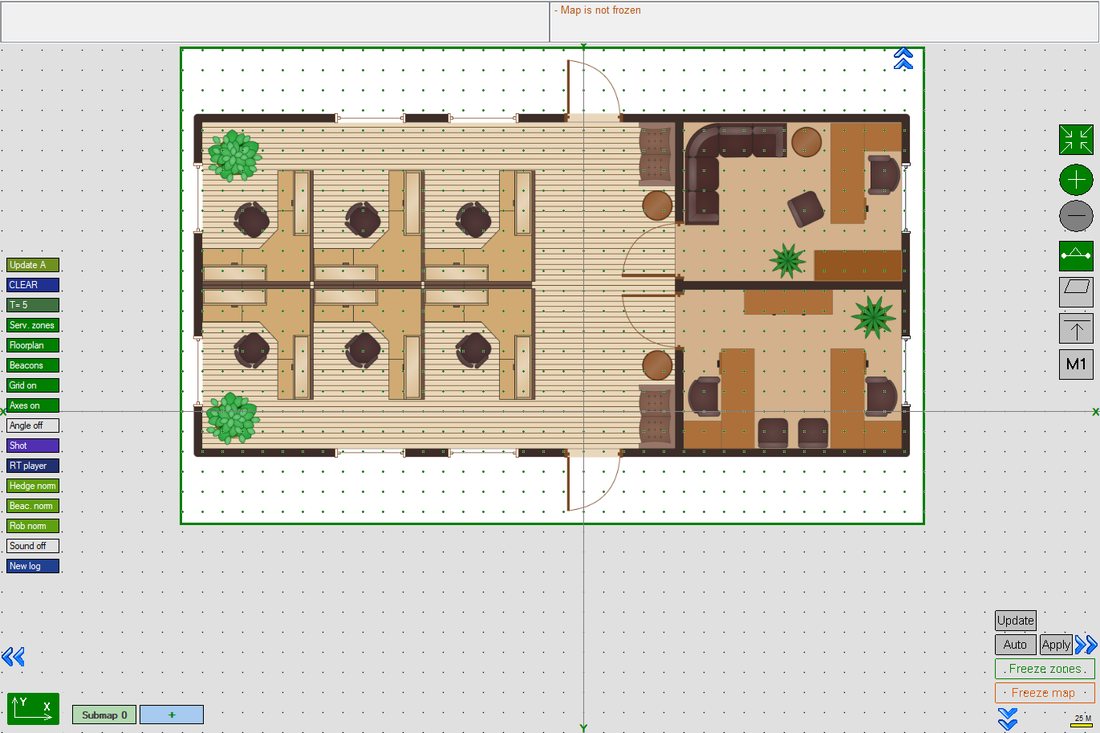
Set floorplan scale by two points:
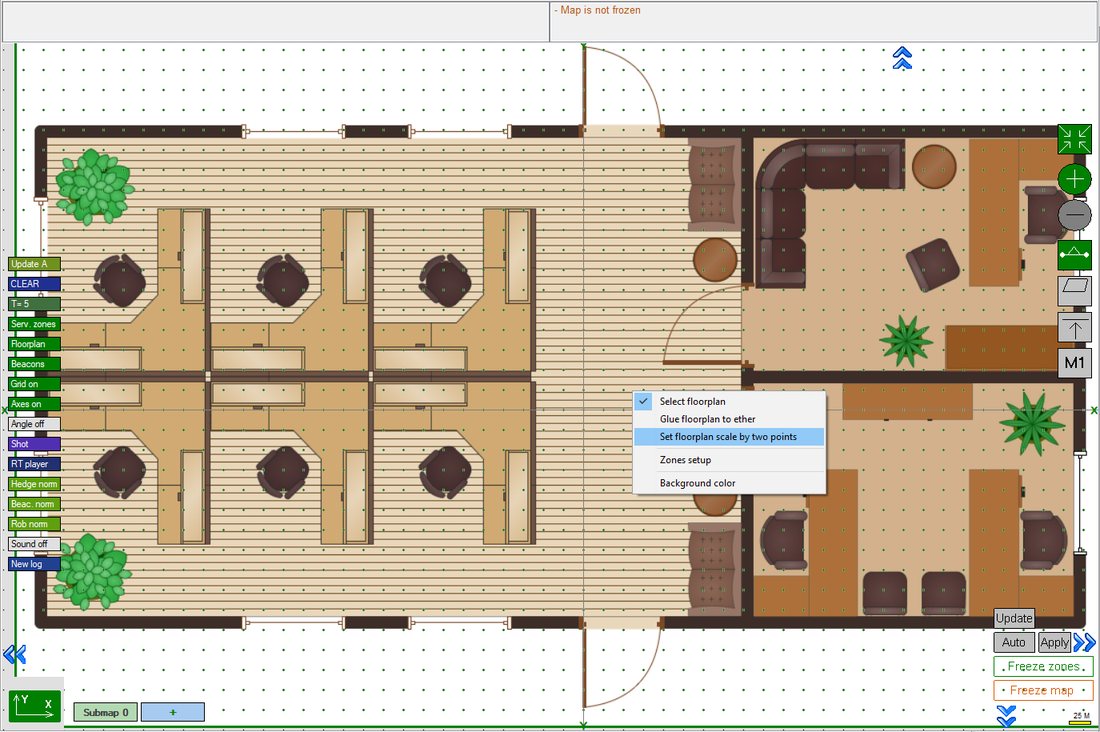 Right Click on the floorplan => Set floorplan scale by two points:
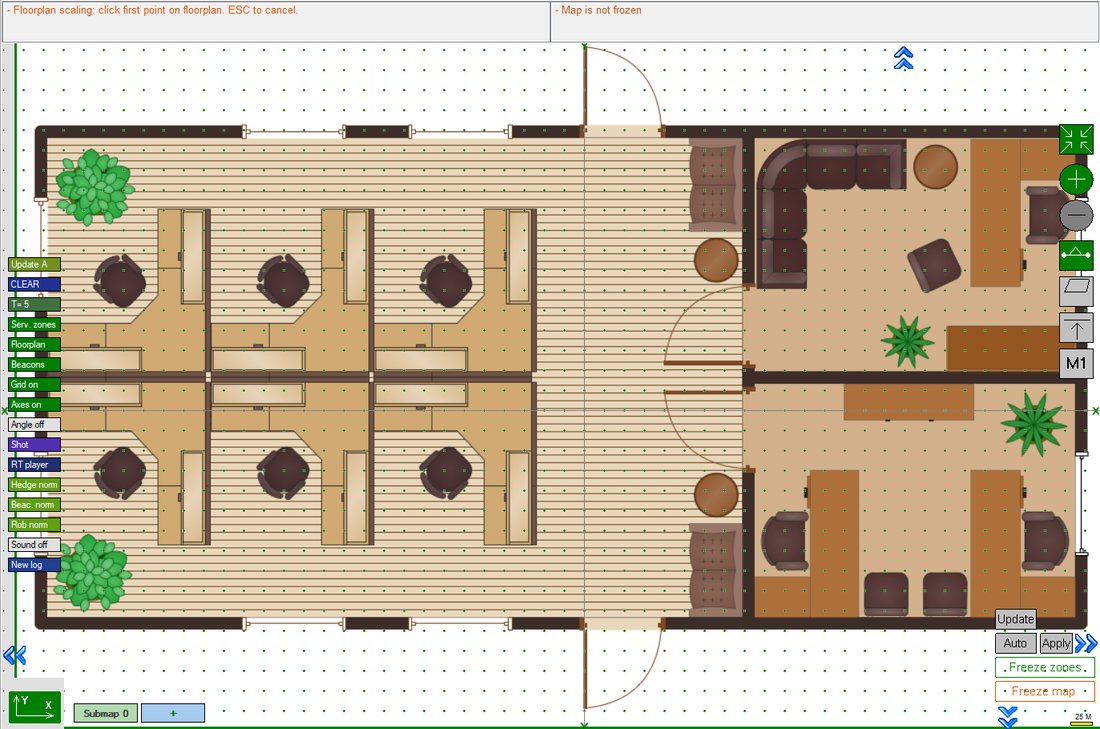 Click the first point on floorplan (press ESC to cancel):
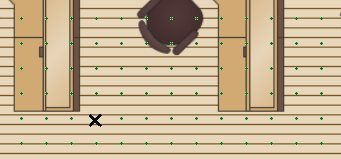 A black cross will appear at a chosen point:
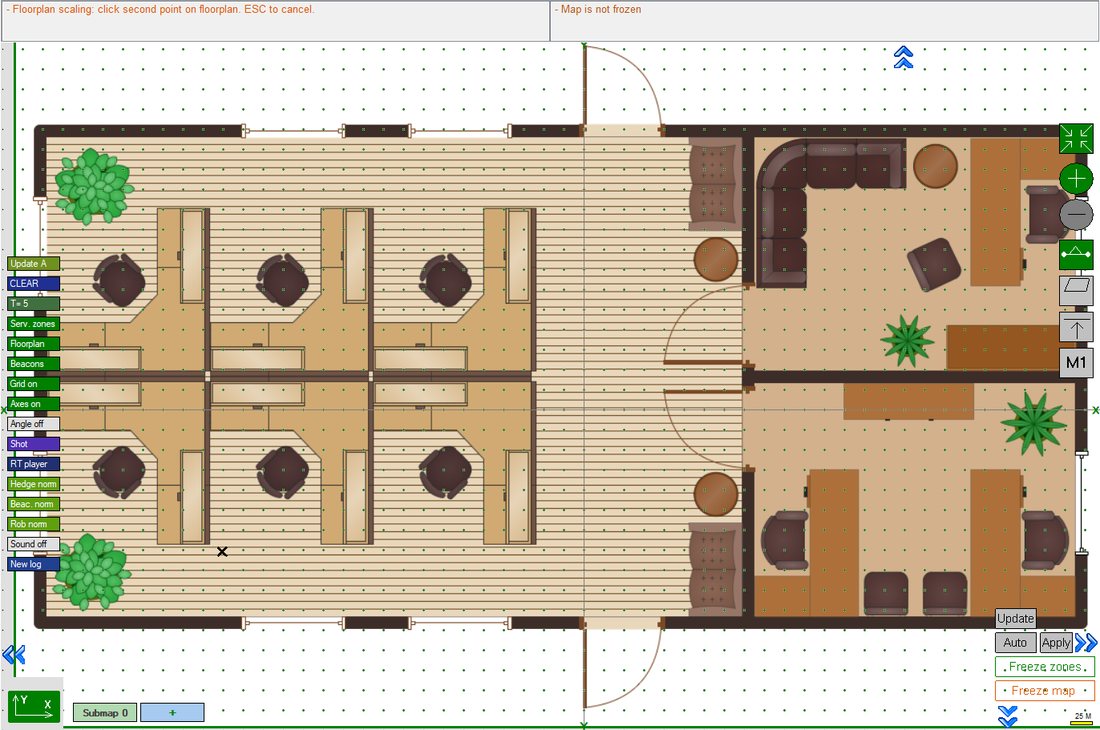 Click the second point on floorplan:
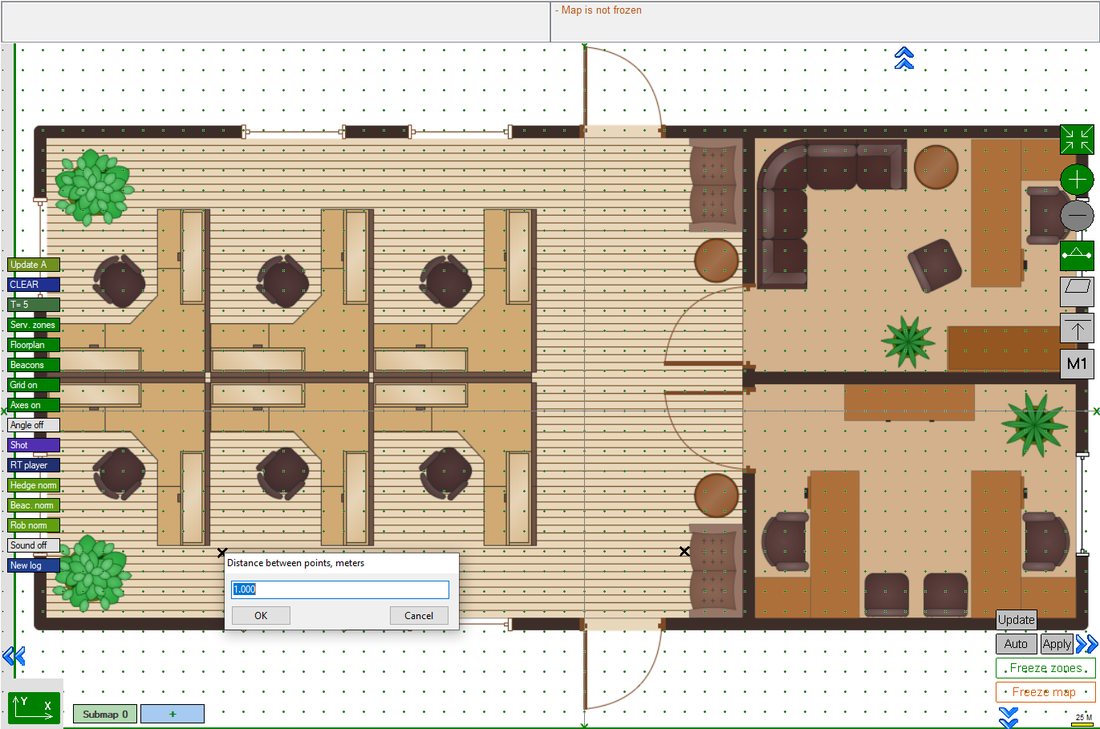 Enter distance between points:
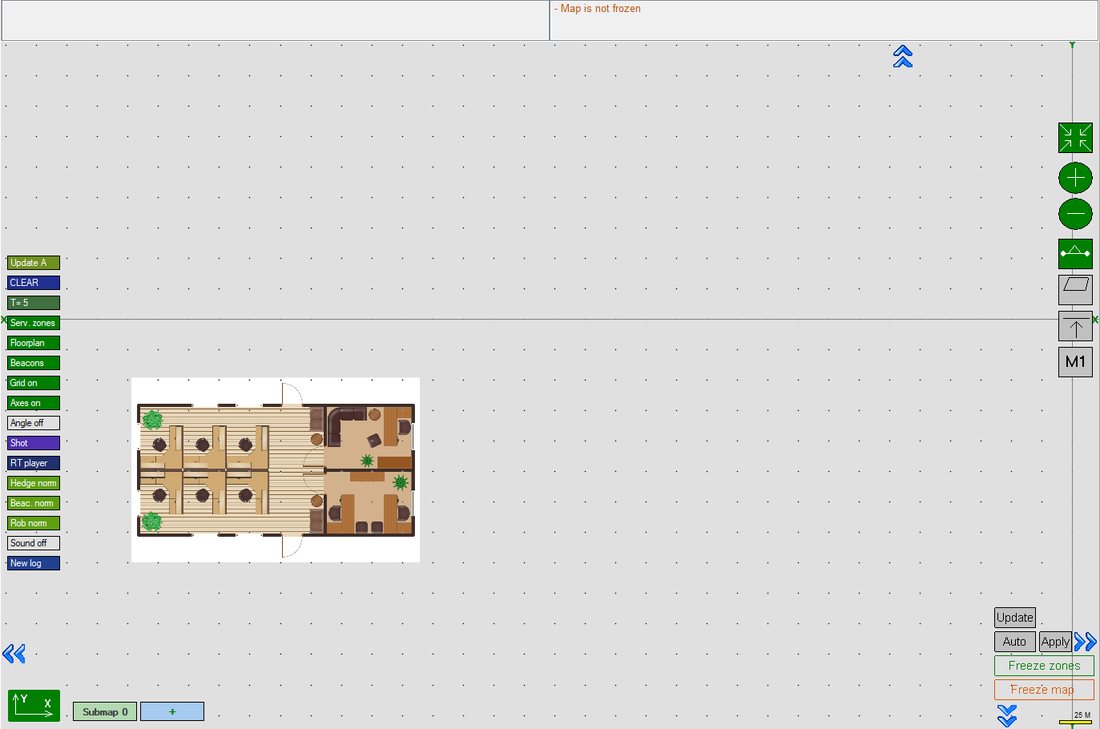 The scale of the plan will adjust to the specified parameters:
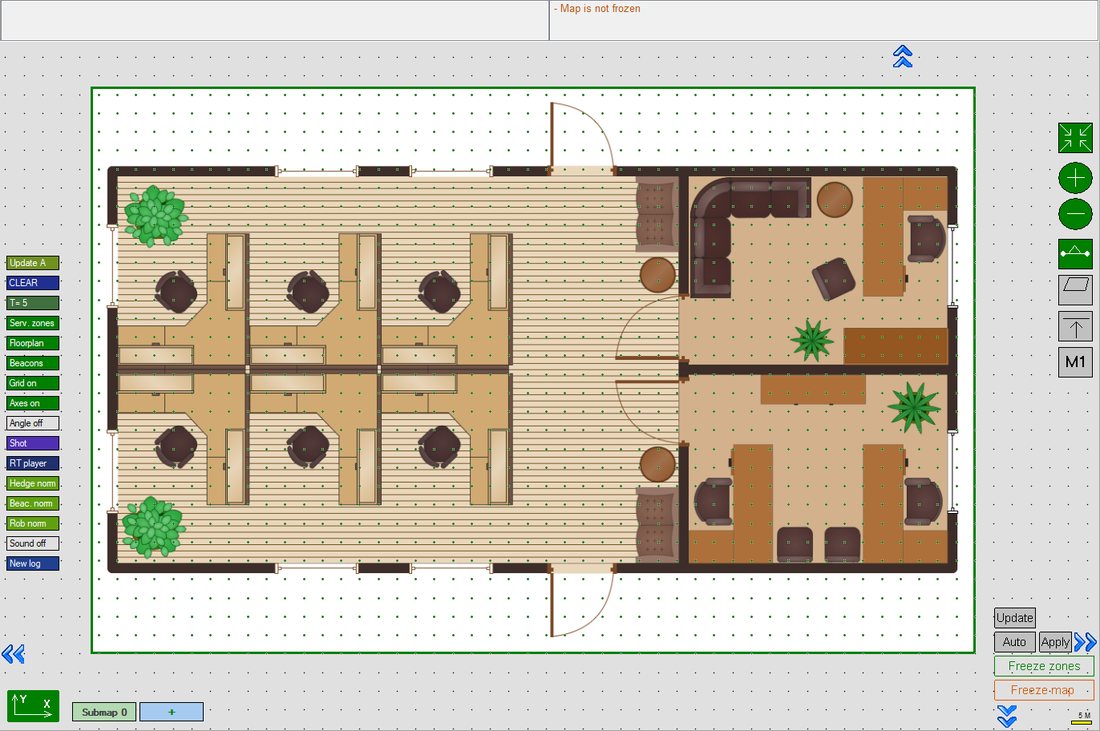 Change the scale of the Map using mouse roll:
Scale settings complited.
Move the Floorplan on the Map
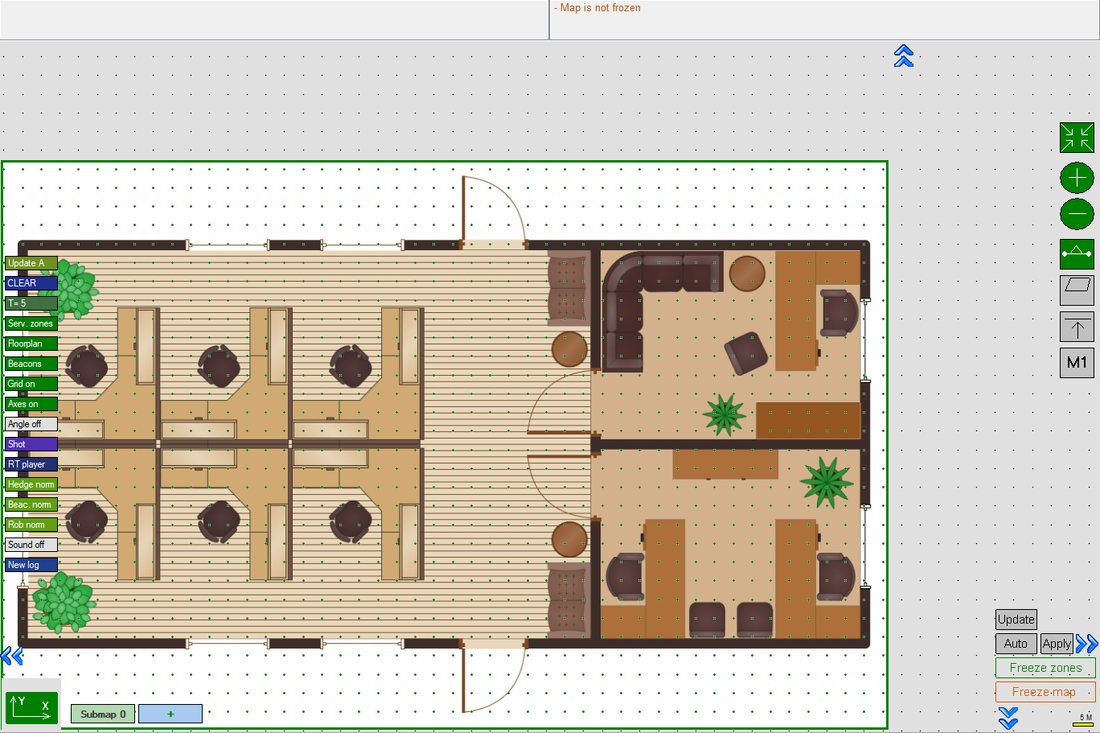 To move the floorplan, click on it with the left mouse button and hold the button down:
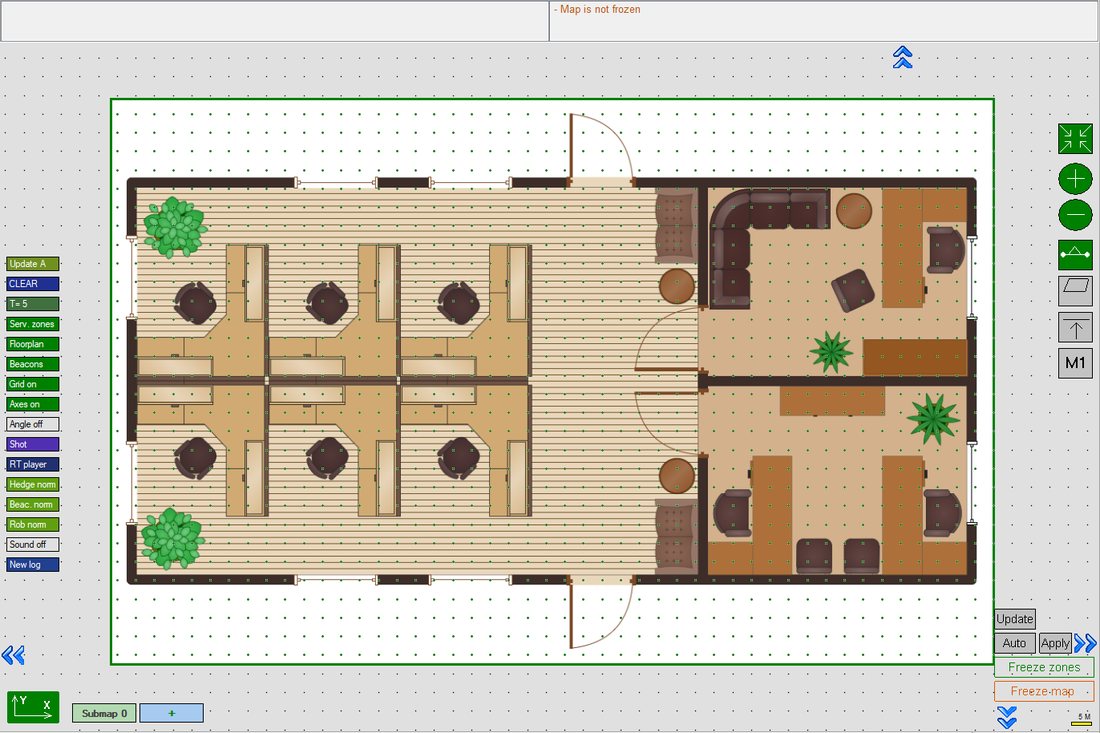 Drag the plan to the desired location:
Other Floorplan Settings
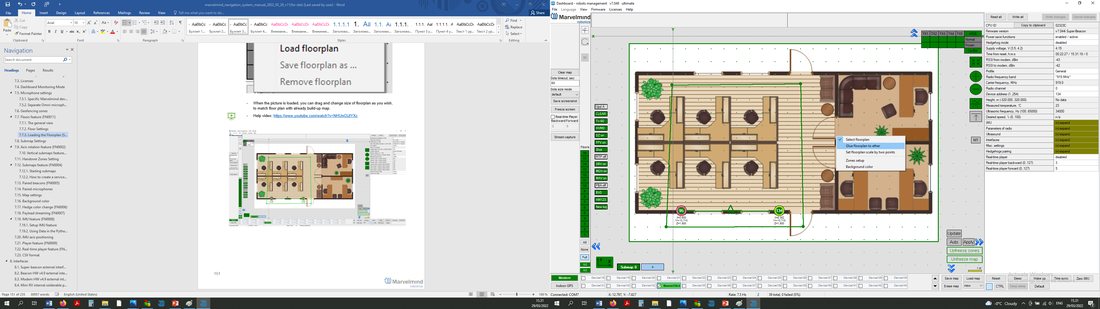 Right-click on a floorplan area to see an additional menu. Press “Glue floorplan to ether” to fix the floor plan’s position according to the map grid.
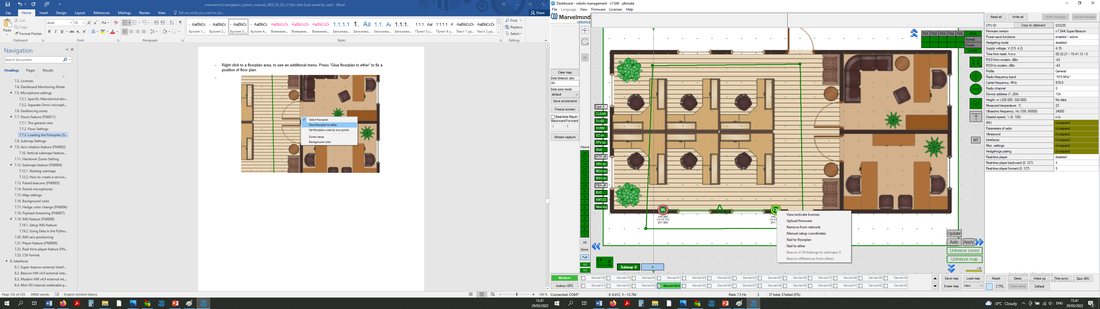 Right-click a beacon to see an additional menu. You can nail the beacon to a floor plan or an ether here.
 Filters
Those features help to get more stable tracking and avoid “jumps” of the mobile beacons.
Spot Filtering
This feature is used to filter mobile beacons “jumps” in the Dashboard. Available in IA, NIA, and MF NIA.
This feature works from the Modem.
How to use:
When the Modem is connected to the PC, choose it in the Dashboard and put a tick next to the Spot filtering parameter. This is number of dots, when filter:



Enable Filtering during tracking, for filtering when device moves.

Window of Averaging (NIA Only)
Sliding window size averaging the position of mobile beacons.
How to use:
Choose Modem when it is connected to the PC and insert the Sliding window size in the “Window of averaging” bar:
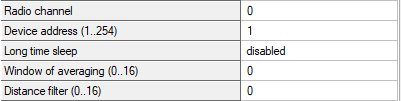
 Notice that when this feature is on, latency increases.
Static Filter
Starting from 4th version of the beacons, they have a Static Filter which detects if the beacon is idle via IMU and filters any static jumps in the Dashboard.
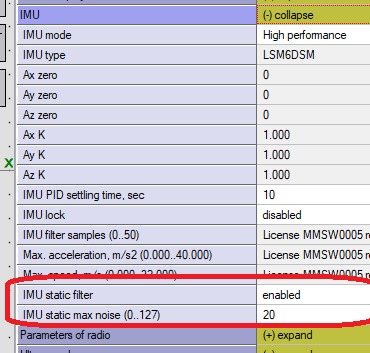
Axis Rotation Feature
General view
The axis extension enables the rotation of the map. There are 90° gaps between views which helps in multi-floor tracking when a side view is essential.


To change the view, click on the icon
Examples of views:
Y, X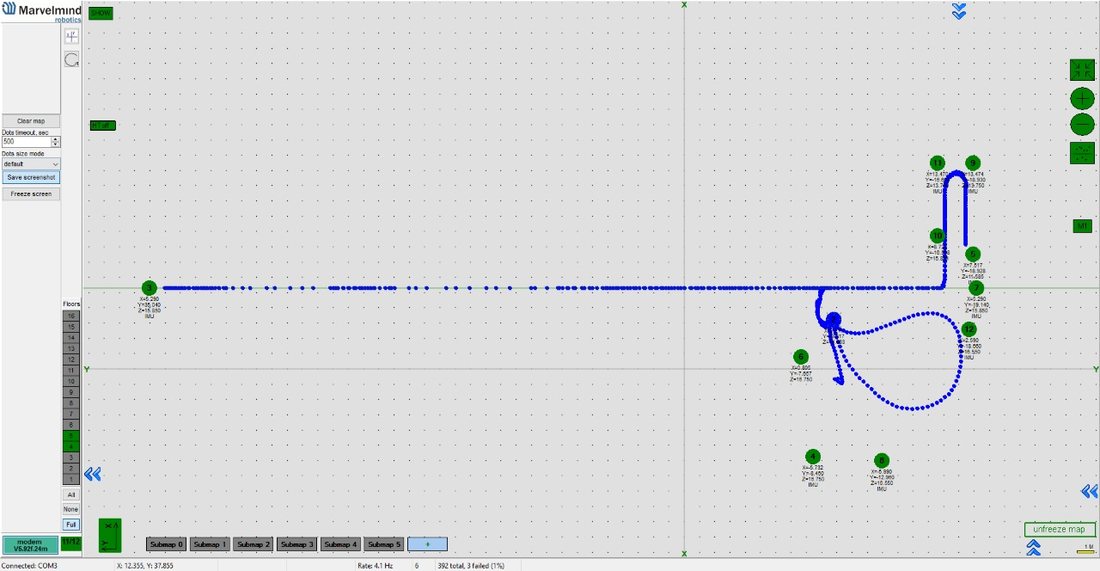
X, Y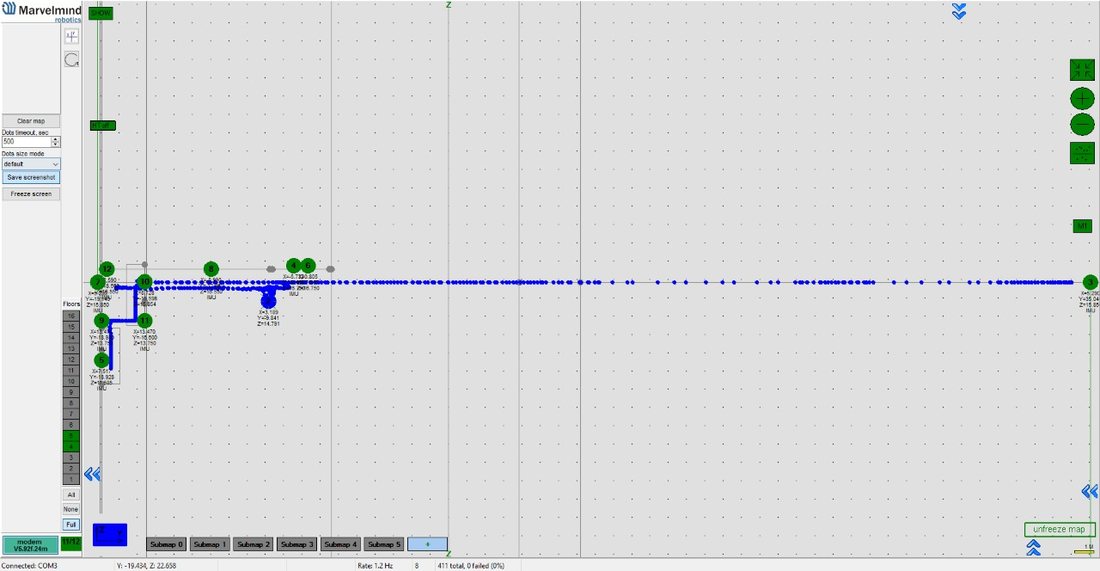
Z, X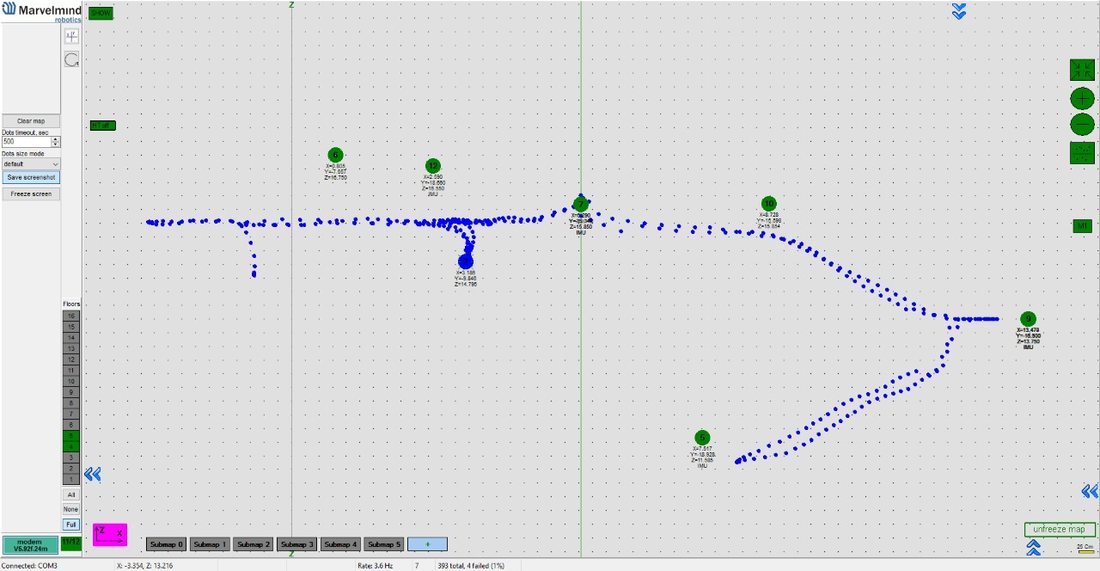
Vertical Submaps Feature
Vertical submap is a new feature for drone flights or other specific cases. It gives the user an opportunity to get solid Z data for vertical movement
- Example: The drone flight
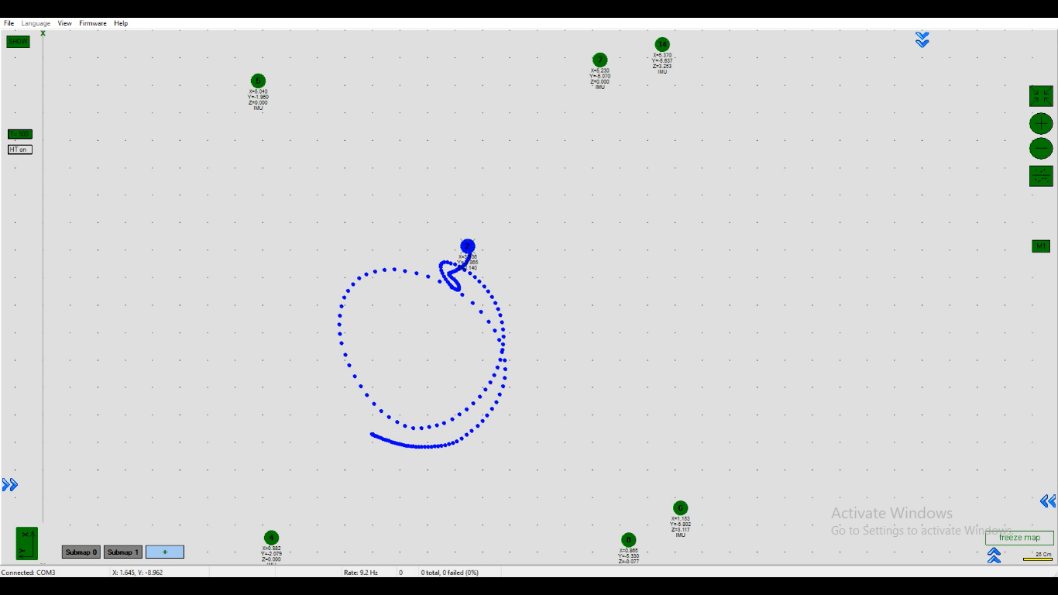
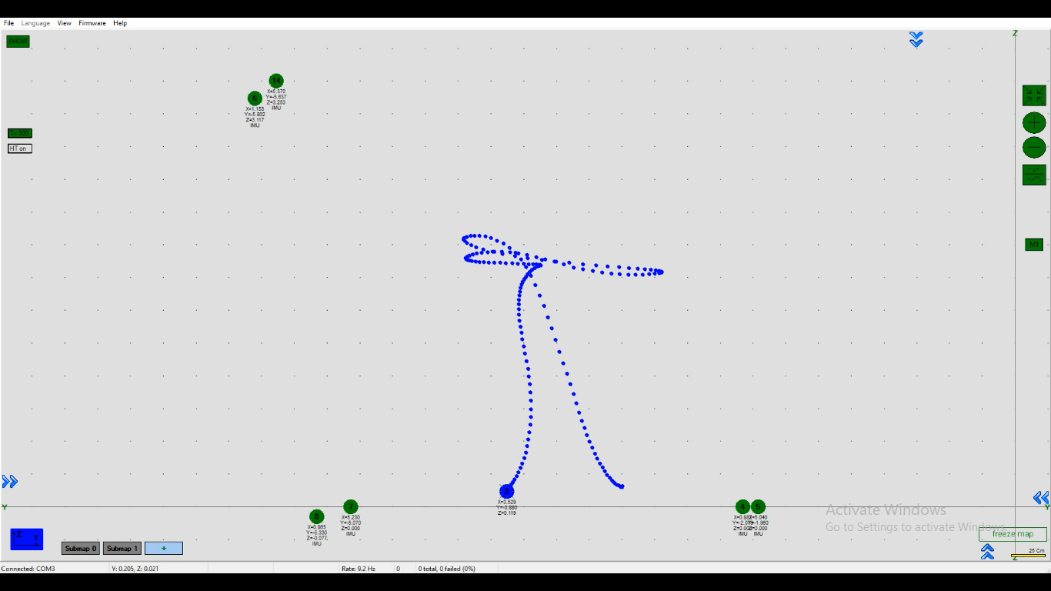
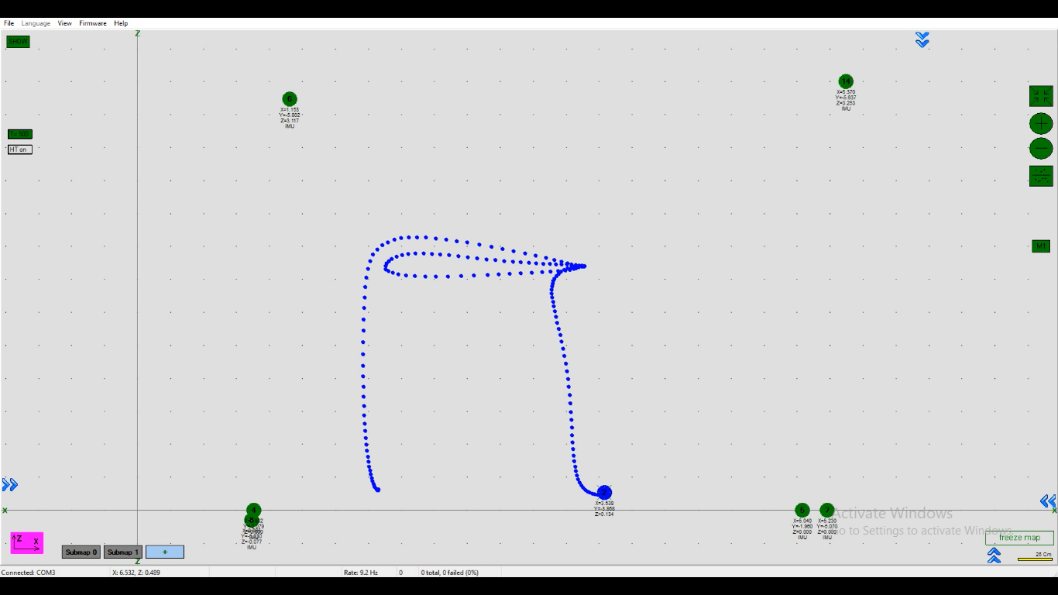
How to Build Vertical Submap for Stable Z:
For this configuration, you need 6 stationary beacons
Place 4 beacons on the ground, facing each other. (make a square where the edge points are beacons, looking in the center)
Place two beacons high on a wall
Turn on RX4 only for beacons on the ground and RX4 and RX2 for beacons on the wall
Build the first submap (horizontal) consisting of all ground beacons
Change the Limitation distance to manual and input the value in the submap’s settings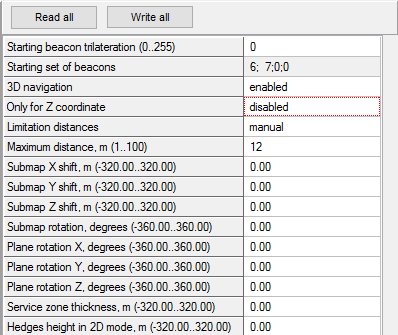
Freeze and lock it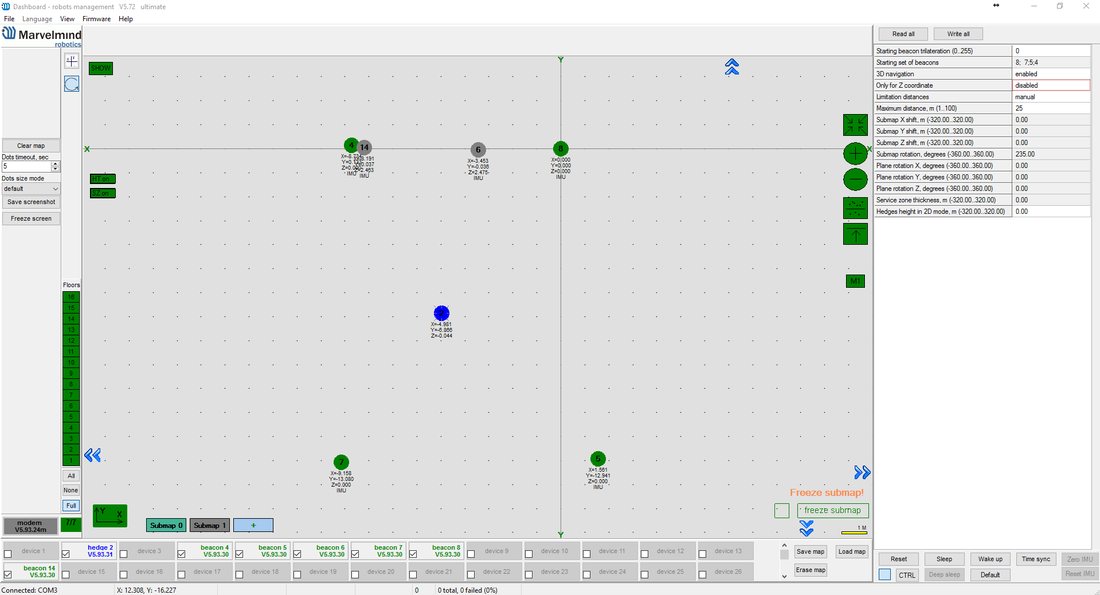
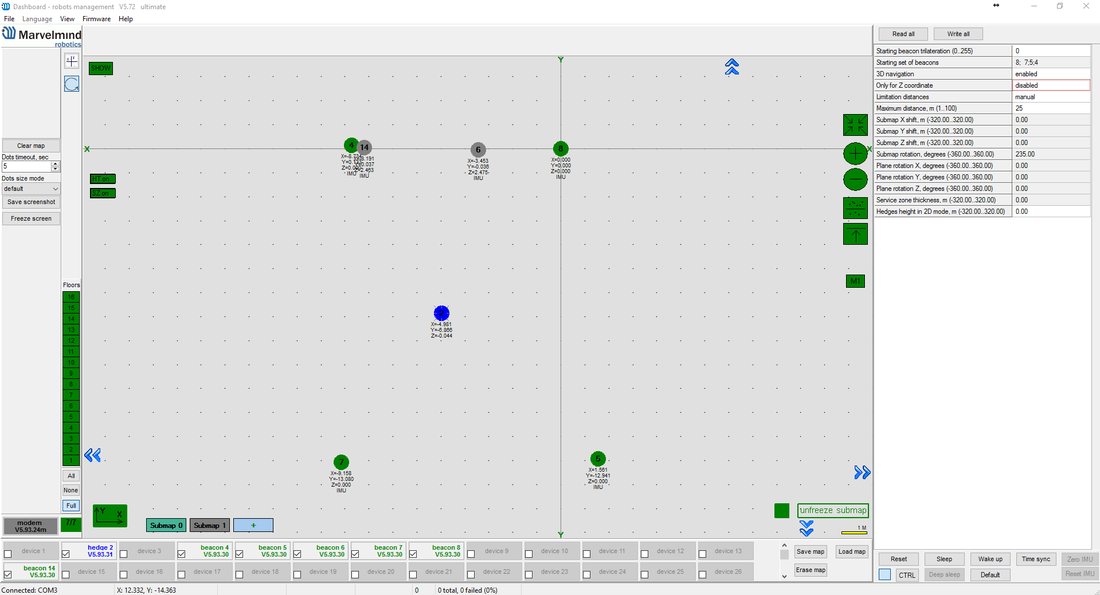
Build the second submap (vertical) horizontally consisting of two wall beacons and two ground beacons (neighboring with wall beacons)
Now, freeze it
Press the axis rotation button 
Click on the axis you want to rotate your submap along (when you point the cursor on the axis, it becomes visible and pink-colored)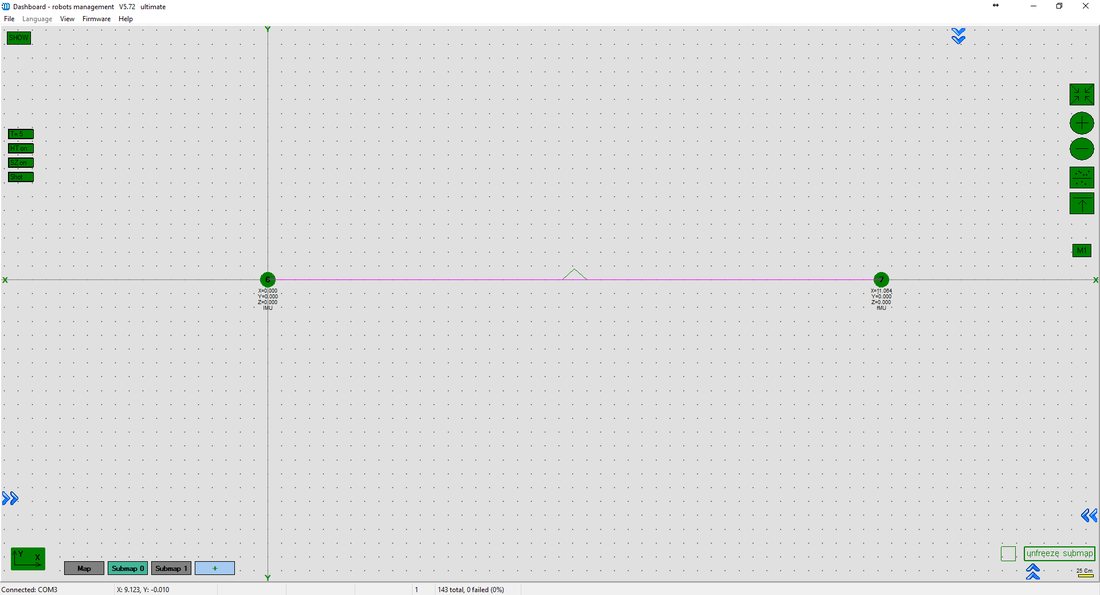
Enter the corner value (90° usually)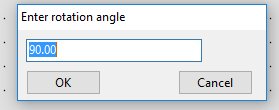
Choose submap 2 and enable “Only for Z coordinates” mode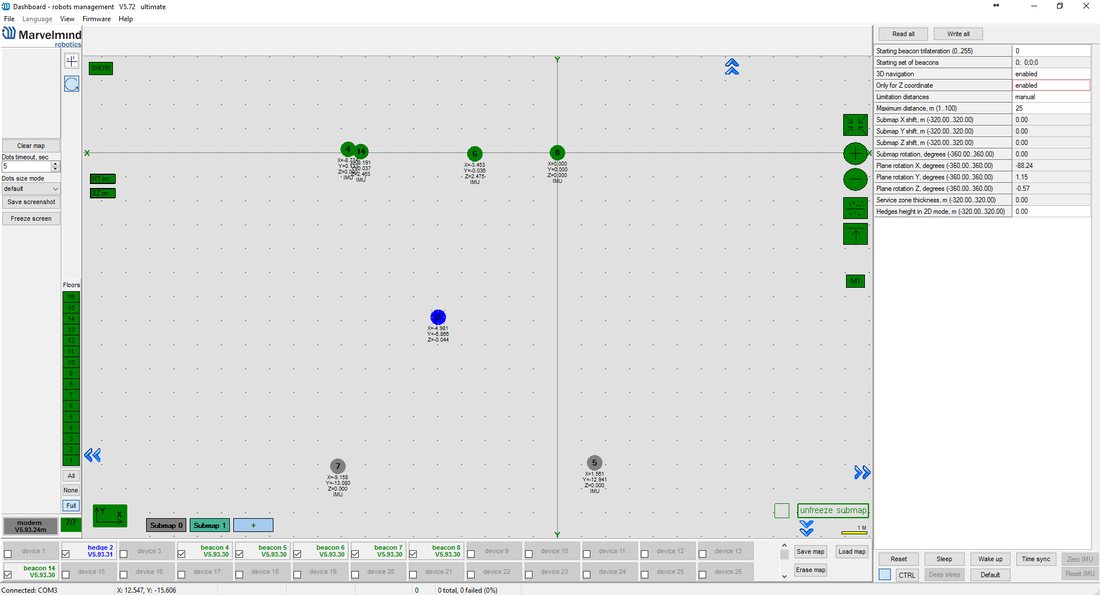
Change the Maximum distance value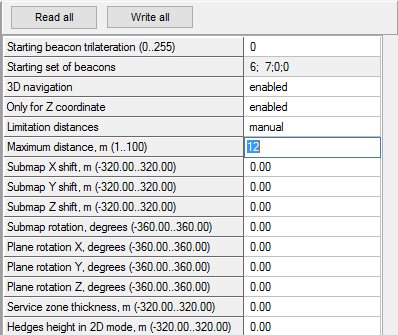
Change views and check the map
Wake up mobile beacon
Track
Submaps Feature
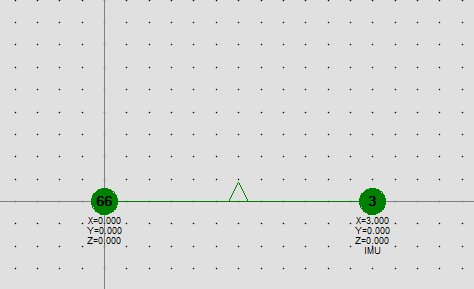
Nose shows direction of the tracking zone
2D submap example
Submaps is a powerful feature that allows you to build large maps (full business centers, factories, and warehouses with total areas of 10,000, 300,000, or more) based on smaller submaps (30, 1000m2).
 A submap is part of the map. It includes a subset of used beacons covering part of the navigation area. The current version of the Marvelmind system can include up to 10 submaps. Please also check our help video.
Starting Submaps
Hedgehogs do not belong to any submap and can move between sub-map areas. Hedgehogs can be served by multiple submaps at the same time. By default, the map consists of a single submap (Submap0)
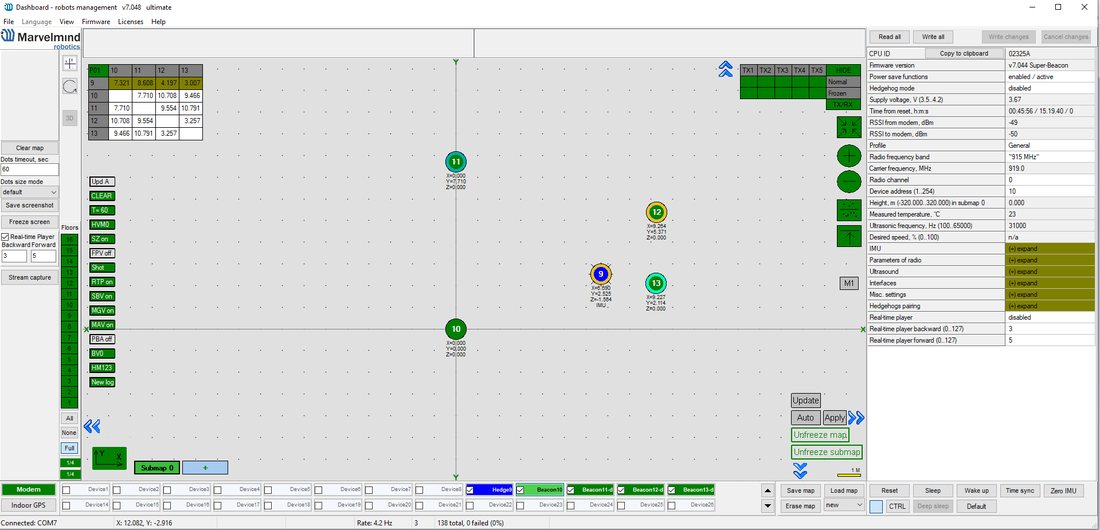 After adding new beacons to the system (waking them up), they appear in the first not frozen submap or in Submap 0 if all beacons are frozen
Pressing the “+” button will add a new empty submap to the system
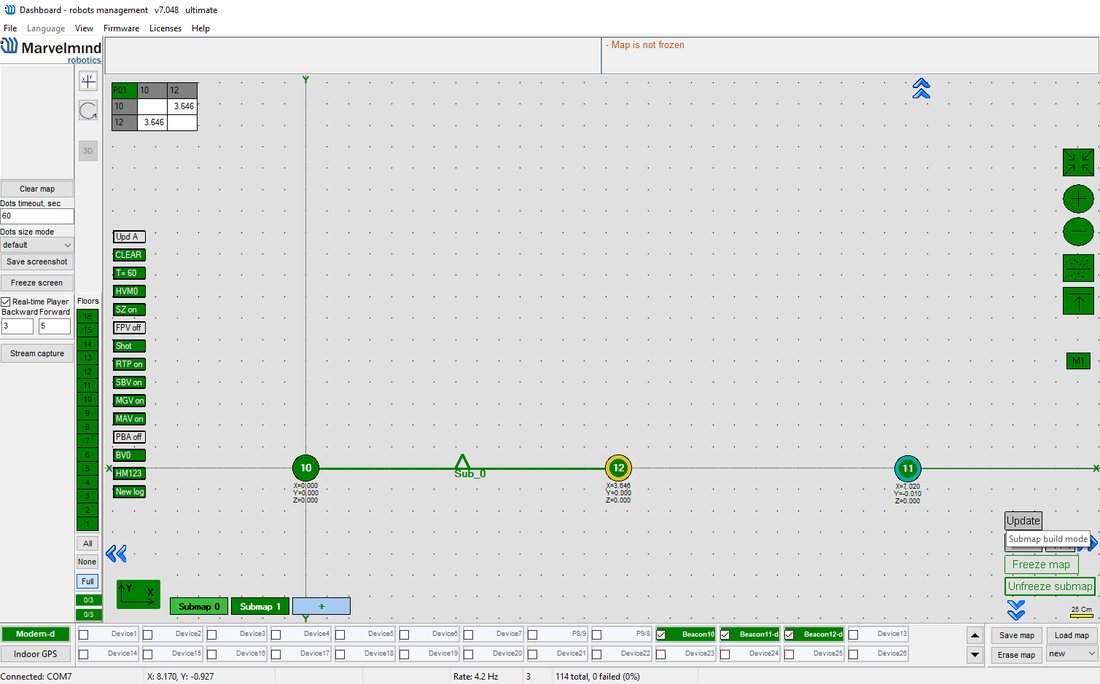 Press the button with the submap number (Submap 0, Submap 1 etc.) – select the corresponding submap
In this state, if the modem button is pressed, the list of parameters on the right side represents some of the parameters of the selected submap, for example, “Starting beacon trilateration,” “Starting set of beacons,” etc.
The system after adding beacons to the Submap 0, adding new submap and the selection of Submap 0
Now we have 4 beacons, all in Submap0 (it can be seen near the table of distances)
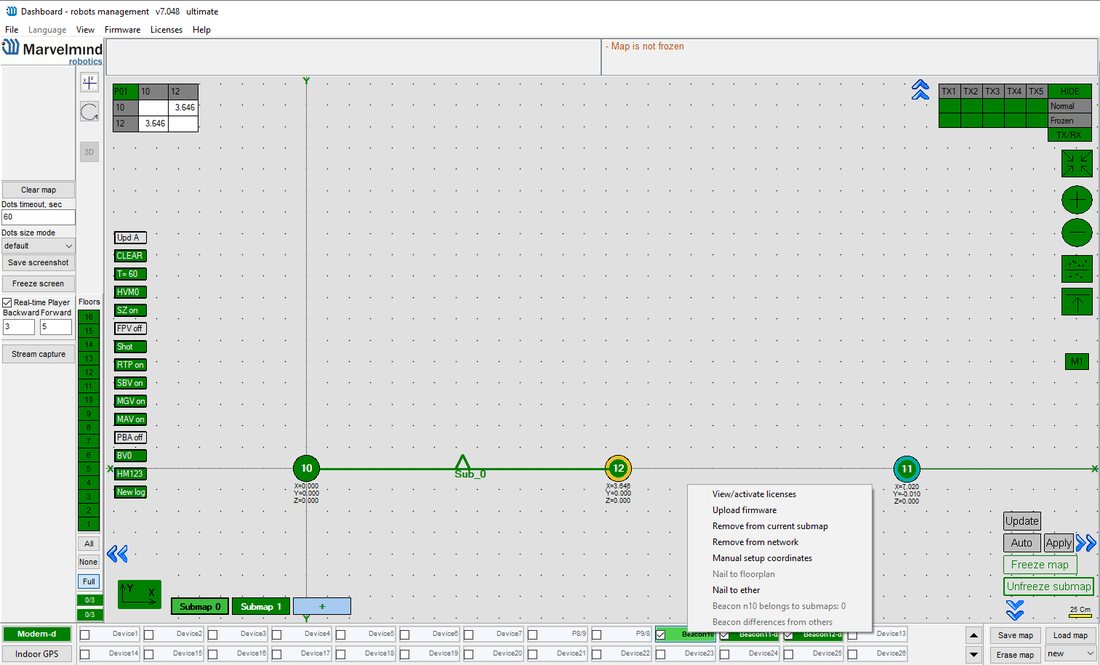 With the submap selected, the context menu of beacons buttons (available by right-clicking) has the functions of adding and removing the beacons from the submap. In the picture above, we are removing beacon 3 from Submap0.” Then we switch to Submap1 and add this beacon to the submap
When the submap is selected, the beacons that do not belong to the submap are colored gray. In the same way, continue with removing beacon 10 from Submap0 and adding it to Submap1
Now there are two beacons in Submap1, so this submap is built. “Submap 0” is built as well. Now we can freeze both submaps
Pressing the “freeze map” button when the submap is selected will freeze only that submap; pressing the “freeze map” button when the modem is selected will freeze all submaps.
Now we have two good submaps, but they are not correctly located relative to each other. On the right side, the parameters of shift and rotation for the selected submap exist; they can be filled in by hand. But a more user-friendly way is to drag and drop the selected submap using the mouse and holding down the CTRL button.
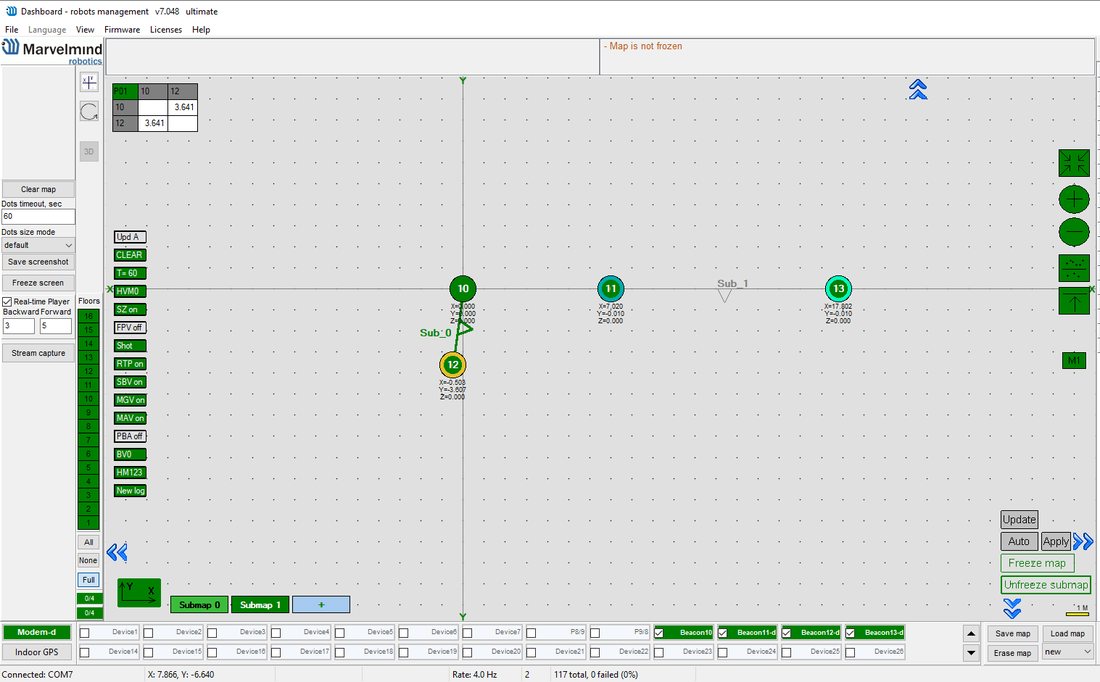 The mouse wheel can be used to rotate the submap. The mirroring button can also be used; it affects only selected submaps.
After some movement, rotation, and mirroring of submaps, we can locate the submaps close to their real relative location
Now the system is ready to use; we can wake up and track the mobile hedgehog
In some cases, the hedgehog can be lost between the submaps if any of the submaps do not cover this area.
Submaps can be removed from the system by using the context menu of the submap selection button (available with a right click)
The M1/M2 parameter is used for the precise superposing of submaps that do not have common beacons. This means that submaps cannot be aligned automatically.
To align submaps:
Build the system like in the previous instruction
Put M2 in “on” mode by clicking the icon. Place the hedgehog near the boundary between two submaps. You will see 2 red hedgehogs blinking; this is how the hedge is seen in two submaps
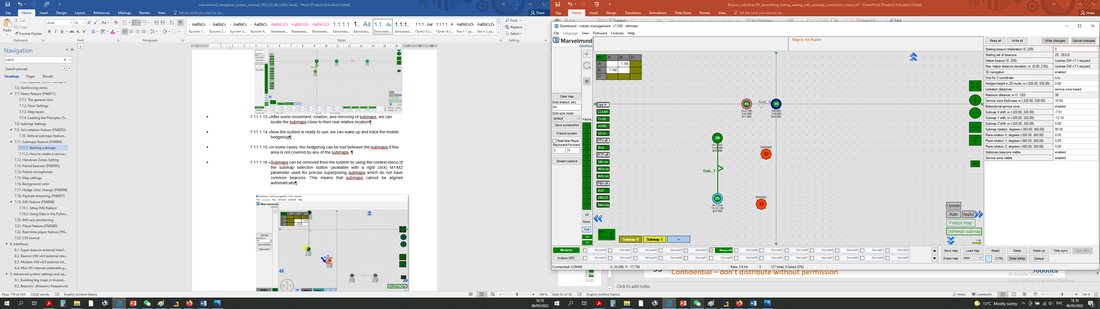
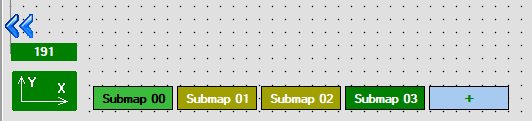 If there are more than two submaps you can choose the preferred ones by clicking shift + left mouse button
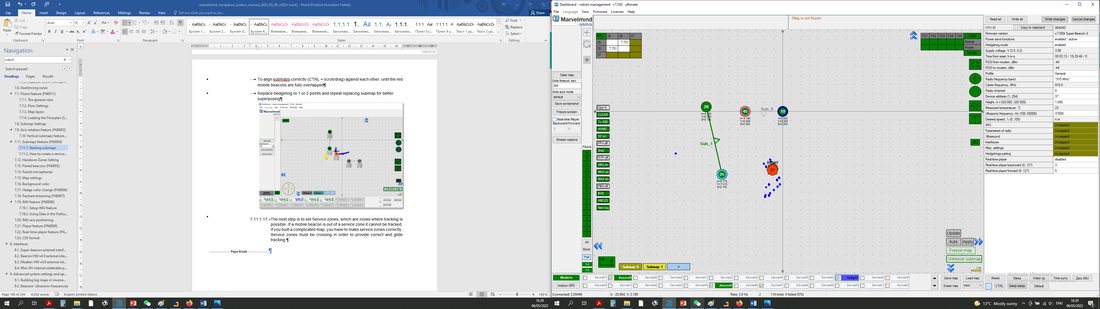 To align submaps correctly (CTRL + scroll/drag) against each other, until the red mobile beacons are fully overlapped
Replace hedgehog to 1 or 2 points and repeat replacing submap for better superposing
The next step is to set Service zones where tracking is possible. If a mobile beacon is outside a service zone, it cannot be tracked. If you build a complicated map, you have to make service zones correctly. Service zones must be crossed to provide correct and glide tracking.
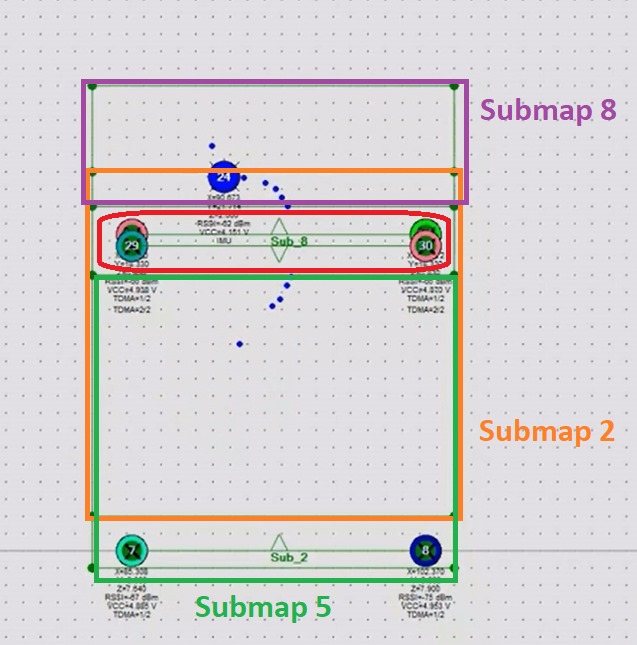 Important reminder: Try not to place submaps in a way that they interfere and emit false signal to another submap
Above is an example of an incorrect map in which Submap 5 emits signals at the back of Submap 8, which leads to an error because Hedgehog 24 receives signals from both Submap 5 and Submap 8 at the same time. The system can’t correctly estimate the location if the Hedgehog is in Submap 8 or Submap 5
To prevent the glare from the wrong signal, we suggest two solutions:
- Use a partition that doesn’t let the wrong signal come through (Recommended)
- Turn off a particular transceiver that is redundant in a specific submaps (for example, emits a signal into a wall or where a hedgehog won’t be), which might emit a false signal to another submap (Check chapter Disabling and enabling specific transducers)
How to Create a Service Zone:
Choose submap (click on the submap icon).
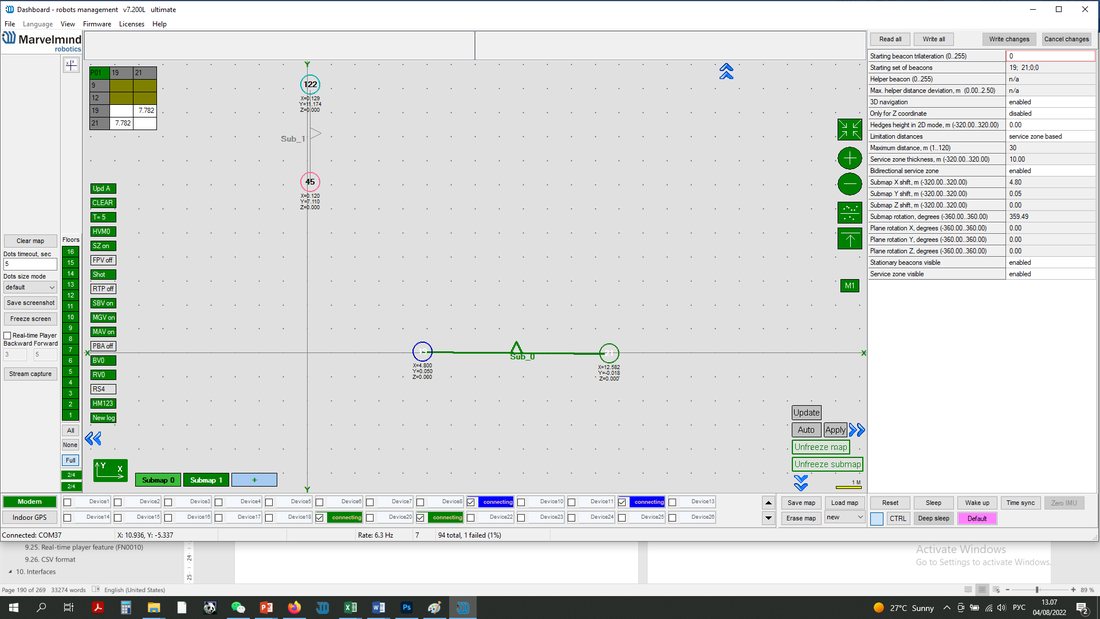
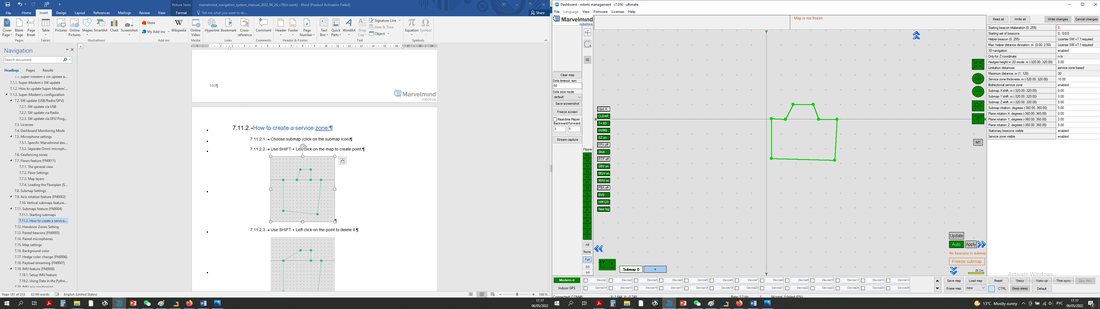
Use SHIFT + Left click on the map to create a point.
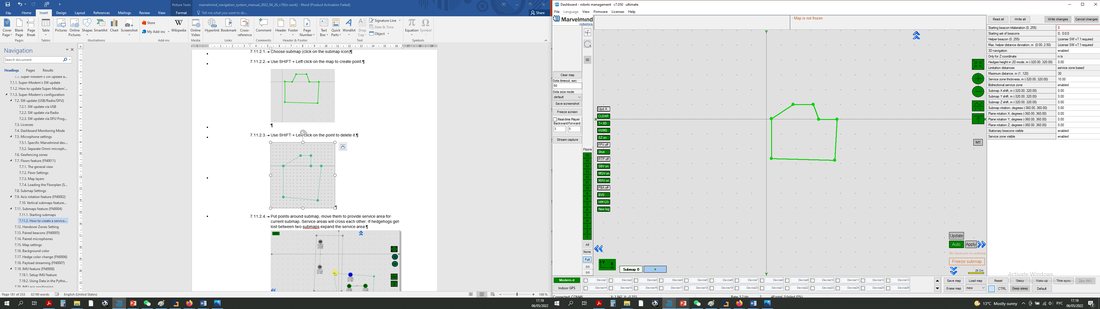 Use SHIFT + Left click on the point to delete it.
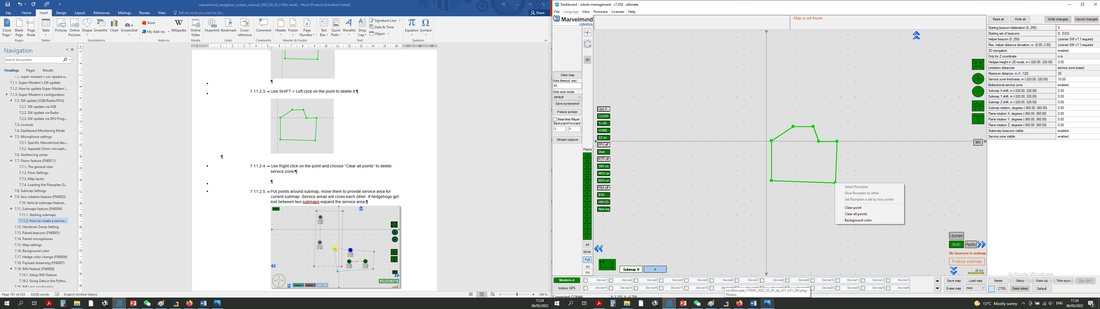 Use Right click on the point and choose “Clear all points” to delete the service zone
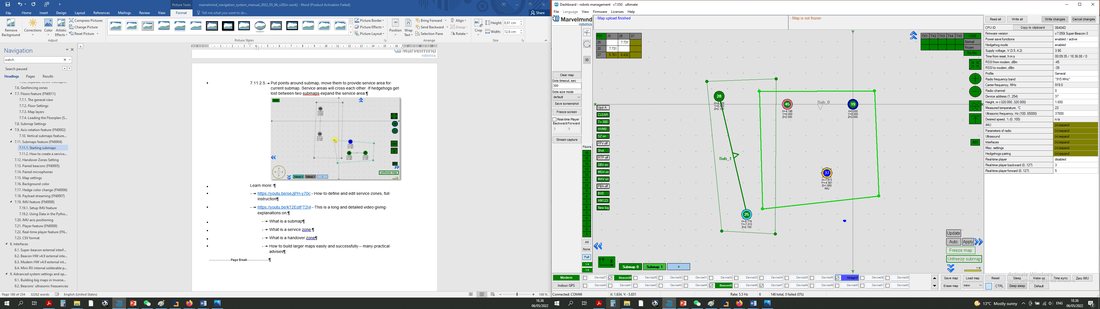 Put points around the submap and move them to provide a service area for the current submap. Service areas will cross each other. If hedgehogs get lost between two submaps, expand the service area.
Learn more:
How to define and edit service zones – How to define and edit service zones, complete instruction
Help: submaps, service zones, handover zones – This is a long and detailed video giving explanations on:
What is a submap
What is a service zone
What is a handover zone
How to build larger maps quickly and successfully – many practical advises
Partially Overlapping Submaps
Submaps can have different overlapping and service zones settings.
There are a few ways to set up an overlapping:
- Partially overlapping submaps (Recommended)
- Full overlapping submaps
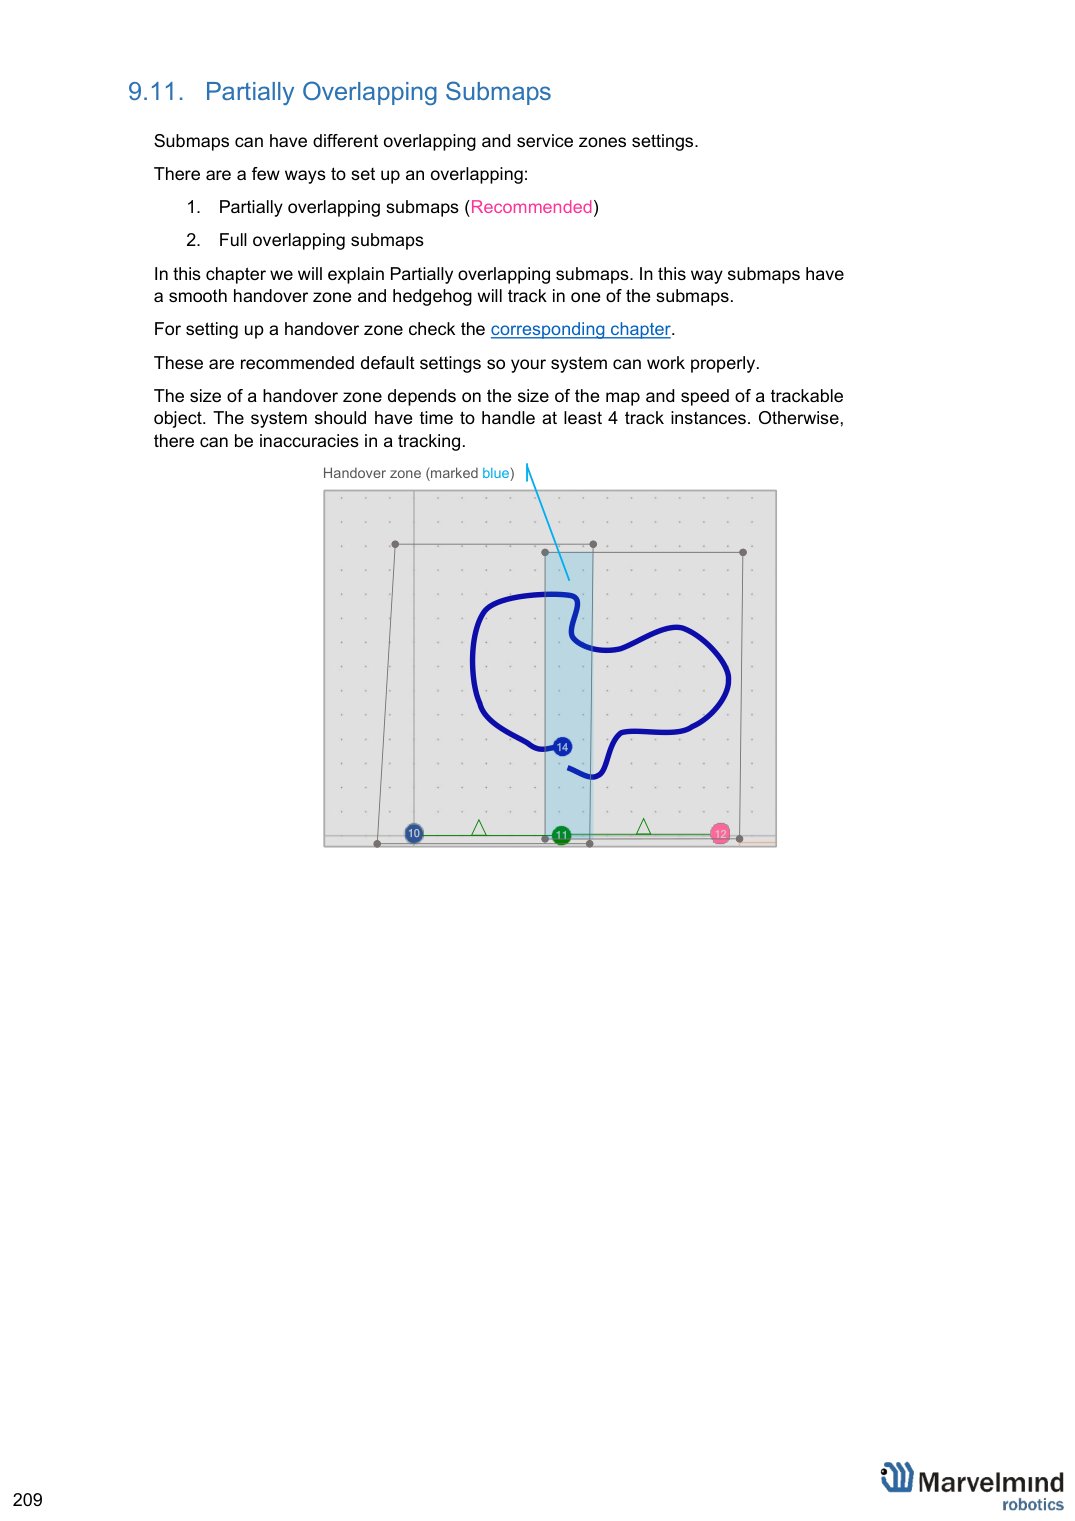
In this chapter we will explain Partially overlapping submaps. In this way submaps have a smooth handover zone and hedgehog will track in one of the submaps.
For setting up a handover zone check the corresponding chapter.
These are recommended default settings so your system can work properly.
The size of a handover zone depends on the size of the map and speed of a trackable object. The system should have time to handle at least 4 track instances. Otherwise, there can be inaccuracies in a tracking.
Full Overlapping Submaps
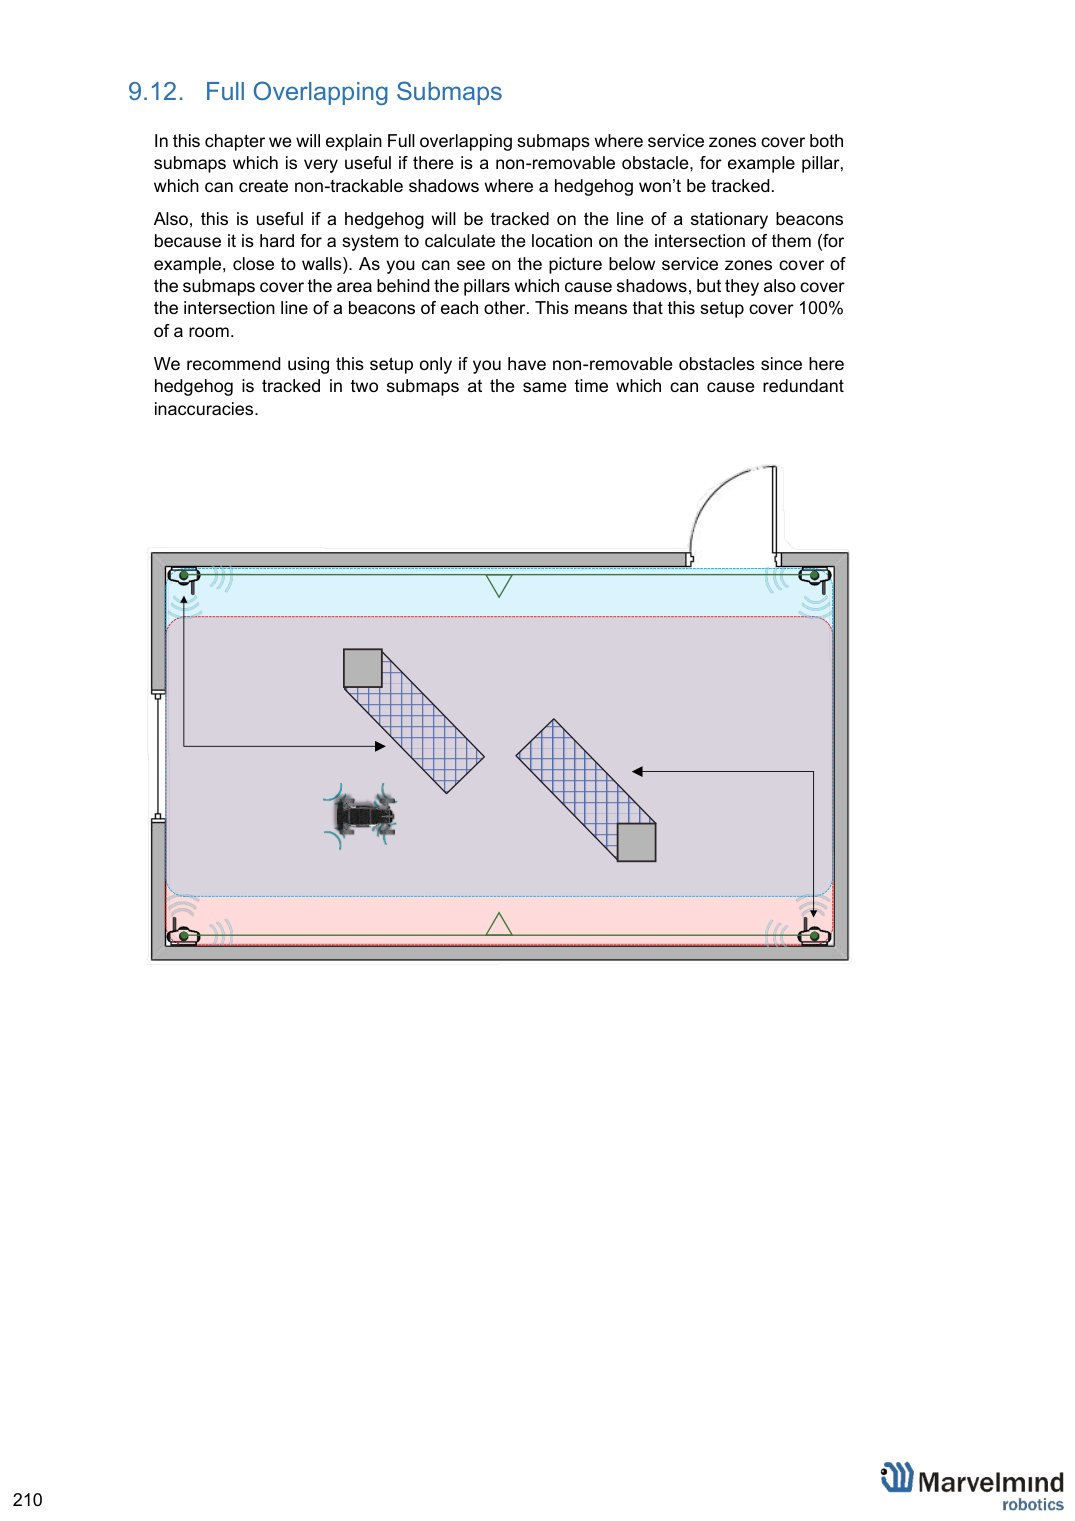
In this chapter we will explain Full overlapping submaps where service zones cover both submaps which is very useful if there is a non-removable obstacle, for example pillar, which can create non-trackable shadows where a hedgehog won’t be tracked.
Also, this is useful if a hedgehog will be tracked on the line of a stationary beacons because it is hard for a system to calculate the location on the intersection of them (for example, close to walls). As you can see on the picture below service zones cover of the submaps cover the area behind the pillars which cause shadows, but they also cover the intersection line of a beacons of each other. This means that this setup cover 100% of a room.
We recommend using this setup only if you have non-removable obstacles since here hedgehog is tracked in two submaps at the same time which can cause redundant inaccuracies.










Submap Settings
Every submap has its own settings.
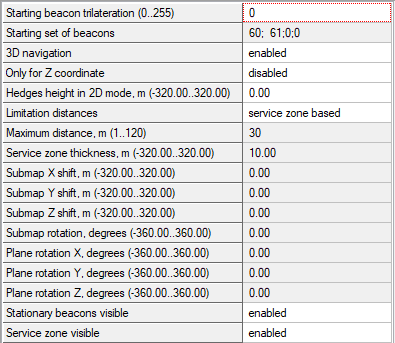
Which beacon will have origin (0; 0; 0) coordinates
Addresses of beacons which are building this submap
3D (X; Y; Z) Tracking mode for this submap
To enable “Vertical submap for stable Z” configuration
Height of hedges for “Vertical submap for stable Z”
Maximum measuring distance limitation mode
Maximum measuring distance between stationary and mobile
Service zone thickness value in meters
Submap X shift value in meters
Submap Y shift value in meters
Submap Z shift value in meters
Submap rotation value in degrees
Plane rotation, X value (“Vertical submaps for stable Z”)
Plane rotation, Y value (“Vertical submaps for stable Z”)
Plane rotation, Z value (“Vertical submaps for stable Z”)
Visibility of stationary beacons (Only displaying setting)
Visibility of service zones (Only displaying setting)
For example, to correspond your submap to a specific floor, you need to adjust the height:
 Left-click on the submap icon to open the settings –
 - Change Submap Z shift value

Handover Zones Setting
 Left-click on the submap icon to open the settings –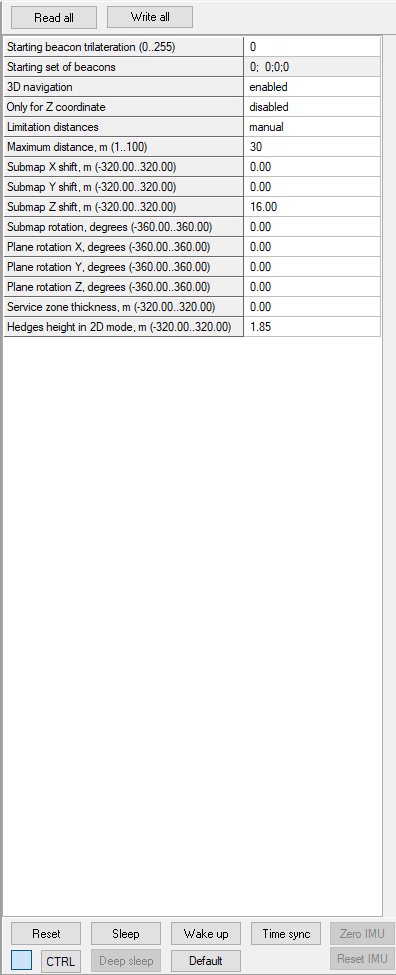
Users must set up handover zones between submaps to guarantee handover quality for complex maps with multi-floor and similar.
How to set handover zones:
- Choose any submap
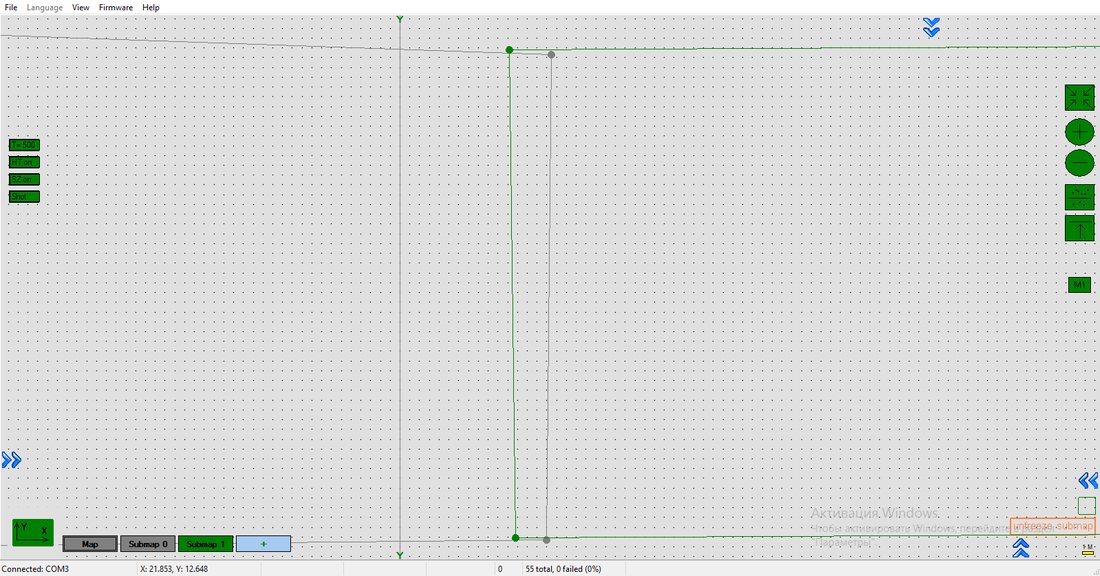
- Use Alt + Left Click on the other submap’s service zone border (neighboring)
- Now, neighboring service zones are colored green (dark green for the chosen submap and light green for neighboring submaps)
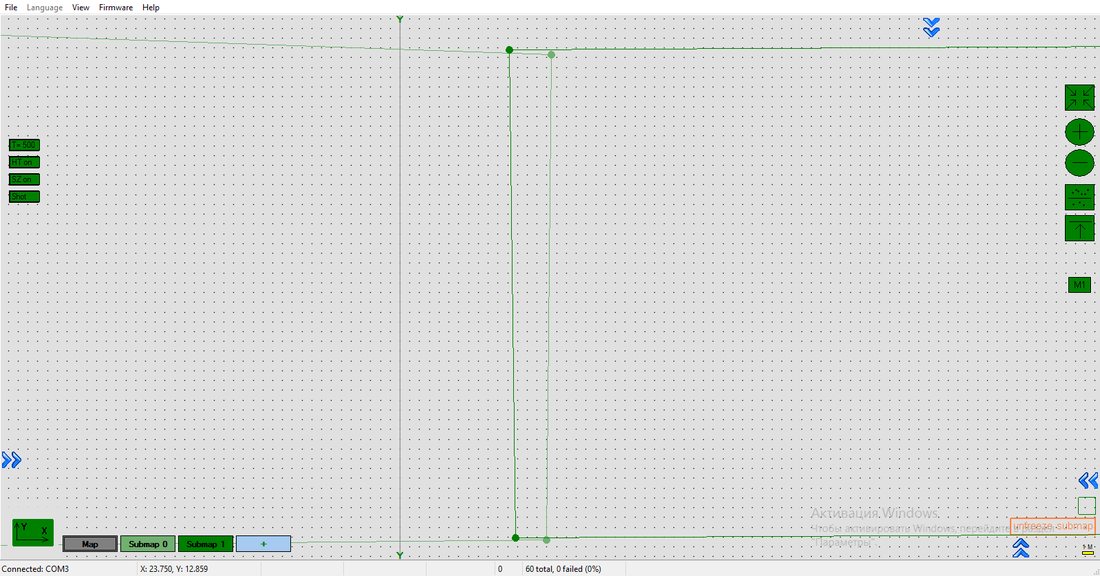
Alt + Left click
Paired Beacons
Two hedgehogs can be paired and operate as a single beacon without reducing the update rate. In this case, you get not only a location but also a direction and stable yaw.
For more information check out the links below:
- Paired Beacons: a step-by-step guide
- 8 basic steps from unpacking to autonomous drive/flight
- Step-by-step approach
- Help: PixHawk + PX4 + Paired Beacons for Location + Direction instead of magnetometers
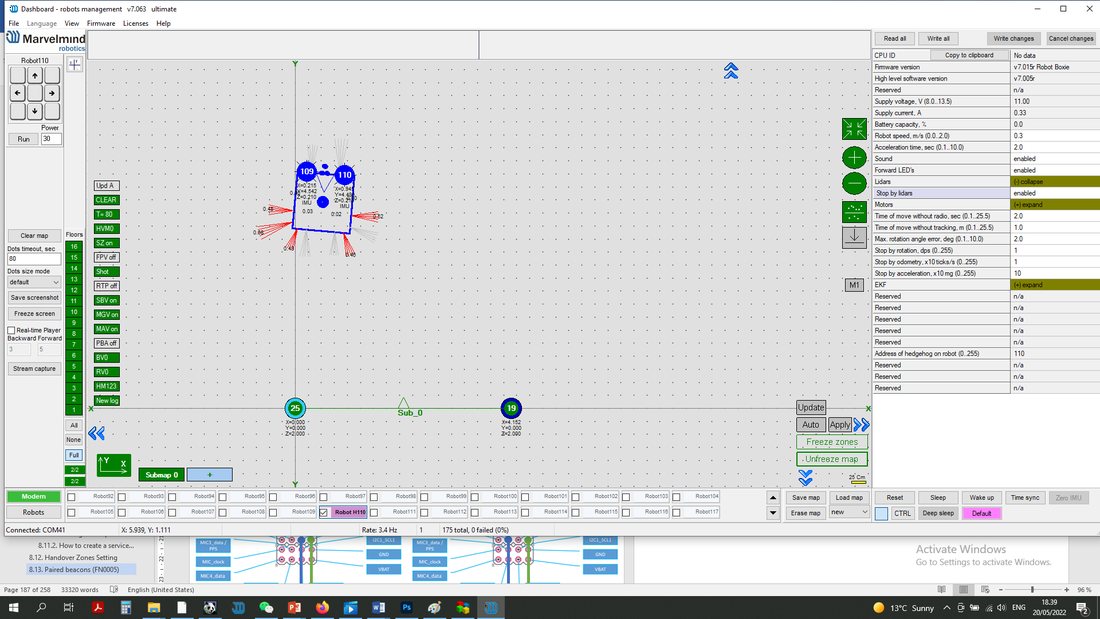
 Moreover, each beacon streams in this mode not only at its own location but also in the direction the pair is facing. This feature hugely simplifies autonomous driving and flight. Here is an updated protocol with the changes.
 Please also check our help video.
How to pair beacons via UART or radio:
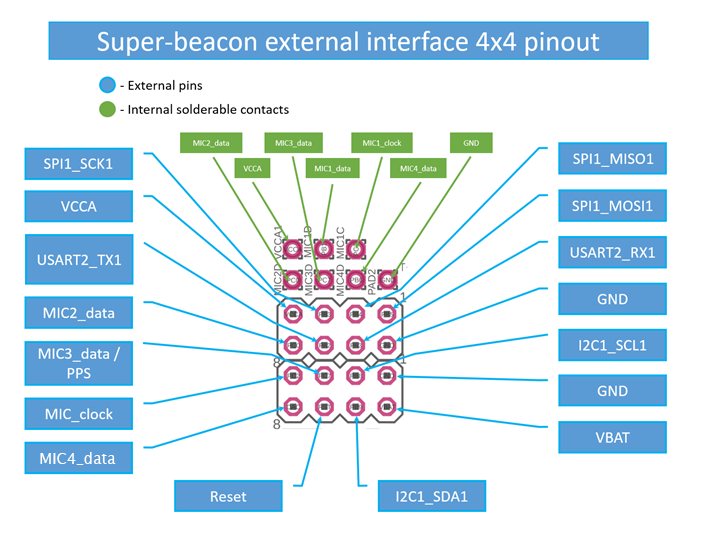
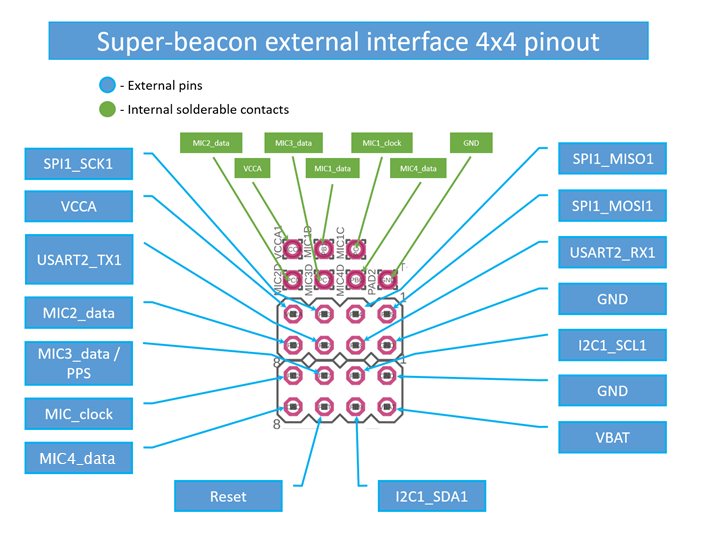
(Recommended) To pair beacons via UART, then connect Super Beacons with a cable from USART_TX of the Following beacon by address (Smaller address number) to USART_RX of the Leading beacon by address (Larger address number) and from GND to GND of each beacon (Note: Look at the pictures below). Only applicable in IA
To pair beacons via Radio, do not connect beacons via anything, and change “Communication in pair” to “via radio” later. Applicable in NIA and IA (In IA, only if the distance between the beacons is more than 1 meter!)
 Wake up one of the pair’s beacons and achieve perfect tracking for a path (remember to freeze the submap before tracking). If tracking is perfect, put this beacon into sleep mode and move to the other beacon in the pair. Turn off Real-Time Player for getting more accurate data!
 Wake up the beacon and repeat the path passed with the first beacon. If everything is good, move to the next step
 Wake up both beacons, do not pair them yet. Repeat the same path for both beacons. If tracking is good, pair the beacons
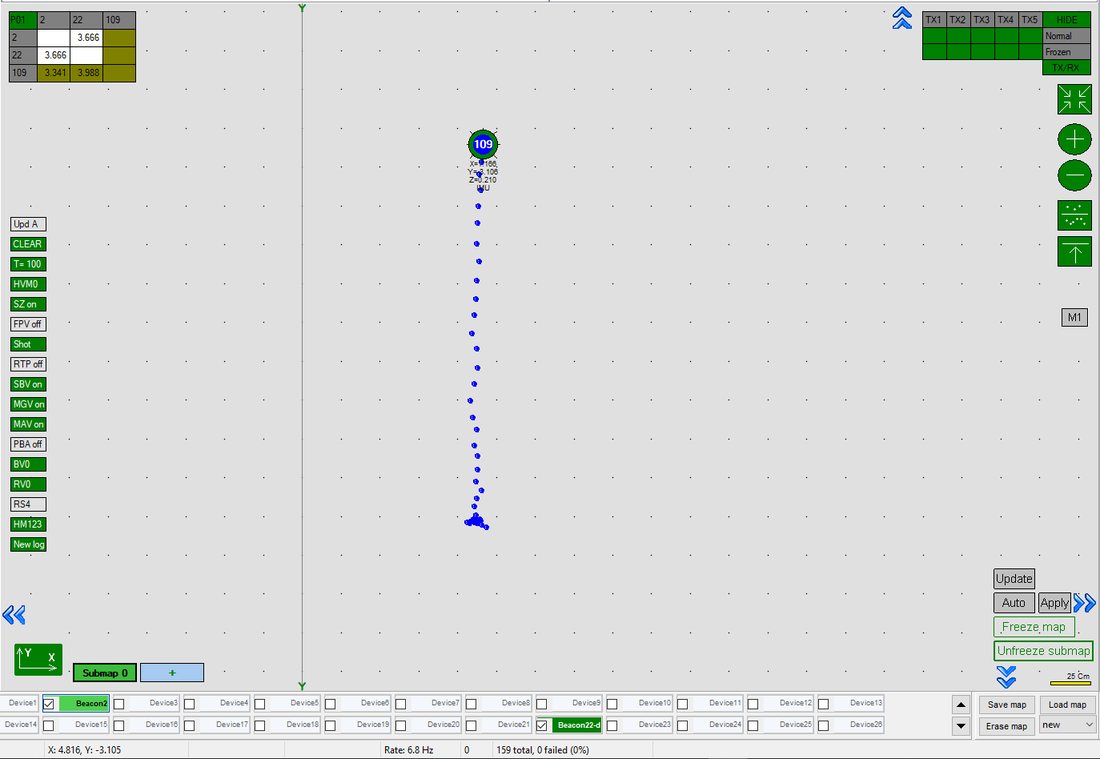 Wake up one of the pair’s beacons and achieve perfect tracking for a path (remember to freeze the submap before tracking). If tracking is perfect, put this beacon into sleep mode and move to the other beacon in the pair. Turn off Real-Time Player for getting more accurate data!
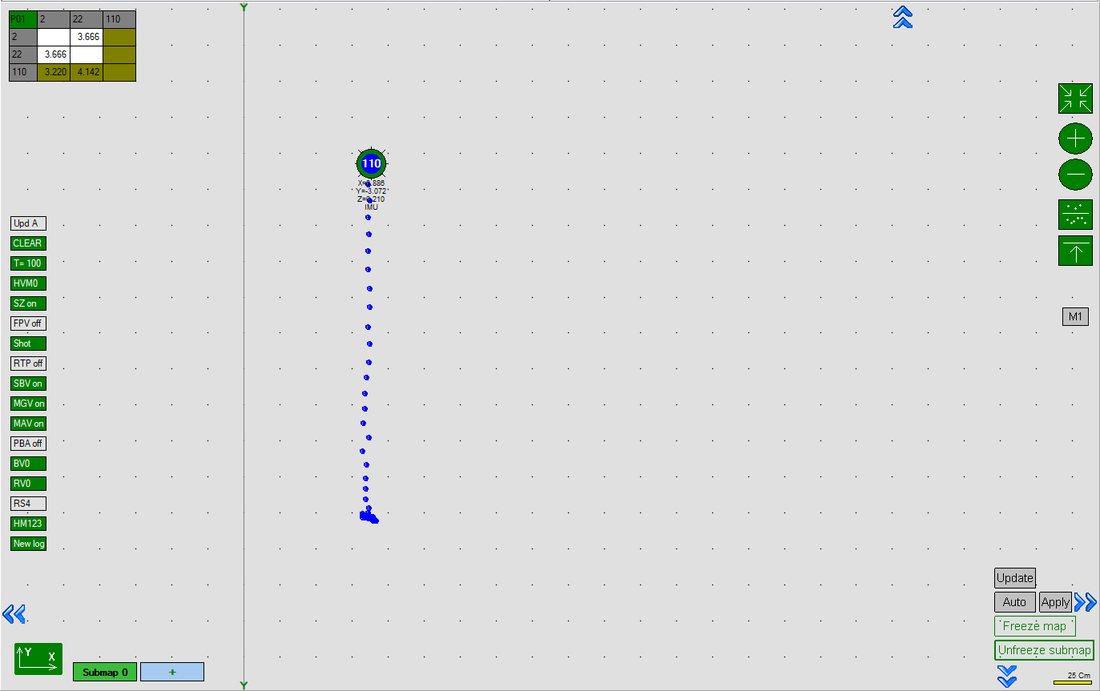 Wake up the beacon and repeat the path passed with the first beacon. If everything is good, move to the next step
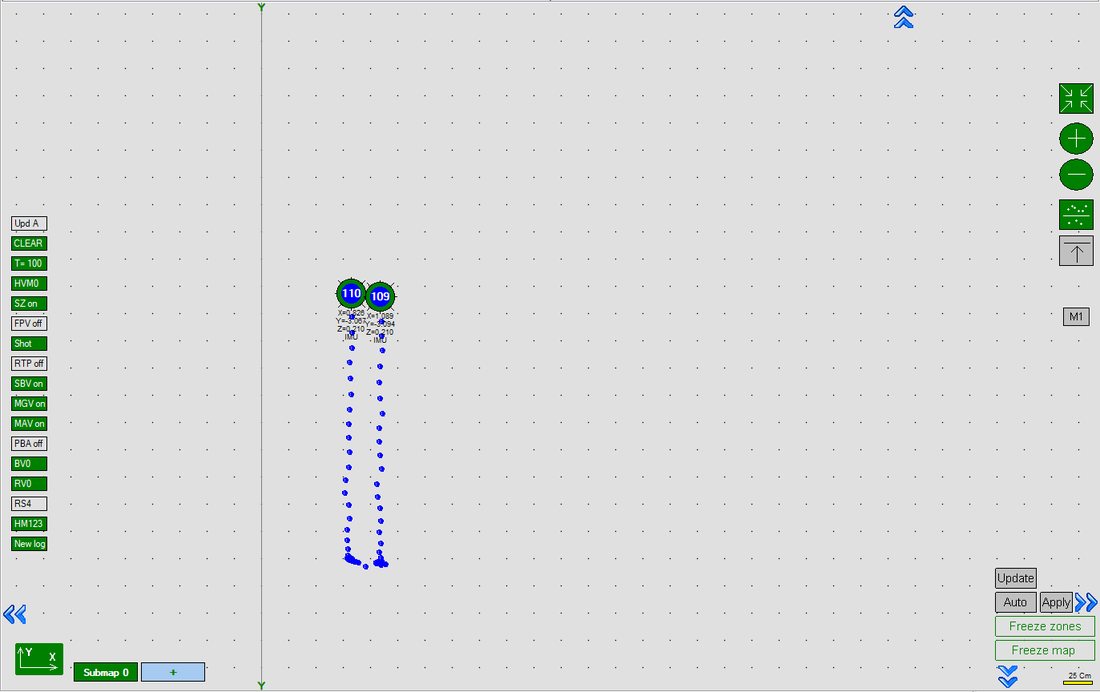 Wake up both beacons, do not pair them yet. Repeat the same path for both beacons. If tracking is good, pair the beacons
Beacons must be at least 20 cm apart. The farther apart the beacons are the more accurate the angle. Also, in IA, UART is strongly recommended if the base between the beacons is less than 1 meter. If the base is more than 1 meter in IA, the communication can be set up via radio.
The Leading beacon must be on the left of the side where it looks. Its position should be the same as shown in the scheme in Step 1.
Choose one beacon and go to the “Pairing mode” parameter, and activate Pairing mode:

Choose “via UART” or “via radio”, depending on your connection, in Communication in pairs. Not applicable in NIA! Proceed to the next step
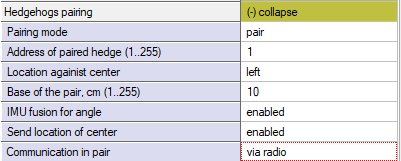
Write the “Address of paired beacon,” which means the number of the beacon currently selected as a hedgehog is paired with:
Beacon 110 Settings
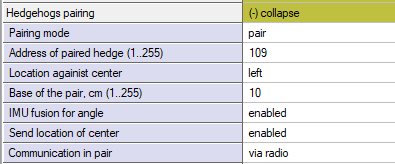
Now choose a location against the center in the parameters relatively to the second beacon:
Beacon 110 Settings
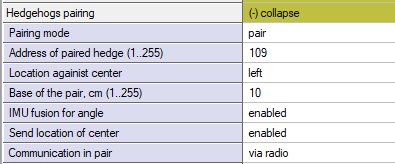
Go to the “Base of the pair” parameter and write the actual distance between paired hedgehogs:
Beacon 110 Settings
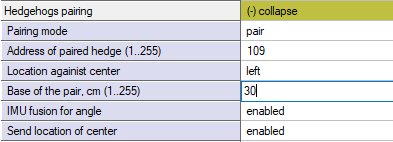
Check that all settings are the same for the paired beacon (except Location against center):
Beacon 109 Settings
Freeze a Map:
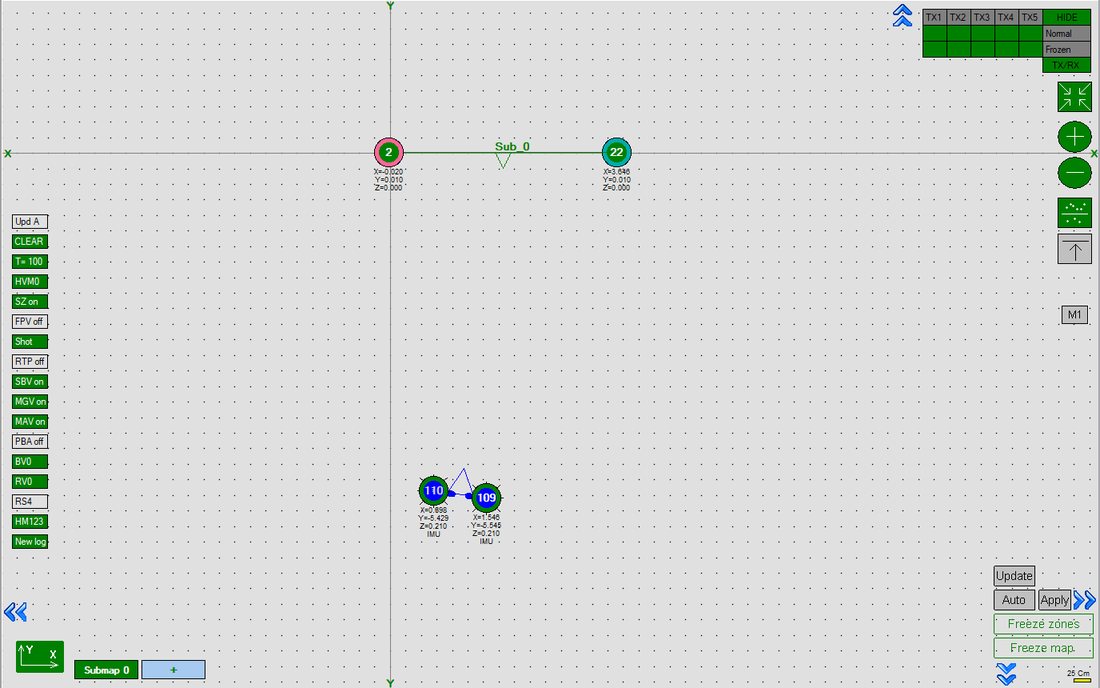
Pairing completed successfully: Paired Microphones
You can also connect an additional microphone and turn on “Paired microphones” mode to get the direction without using a second beacon (only for IA).
For more information check out Multi-head Mini-RX beacon help video
Choose a beacon in the beacon panel
Turn on the microphone that you connected additionally
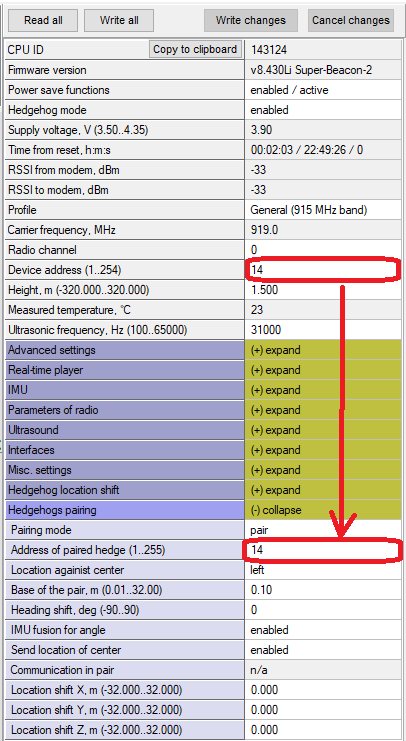 Enter the “Address of paired hedge” address of the beacon that you are setting up (the same address)
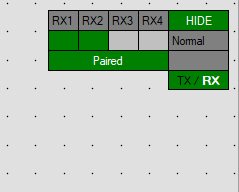
In the microphone settings enable
Georeferencing Point
If your external system uses GNSS, such as GPS, we provide a georeferencing (geo-referencing) point as a reference. We stream directly in NMEA0183 format, so you don’t need to take any additional integration steps.
Geolocation of point X=0, Y=0 is specified.
Note that the Y-axis should point to true North for correct conversion of coordinates!
Rotate the map or submap to achieve this direction. For more helpful information, check this chapter:
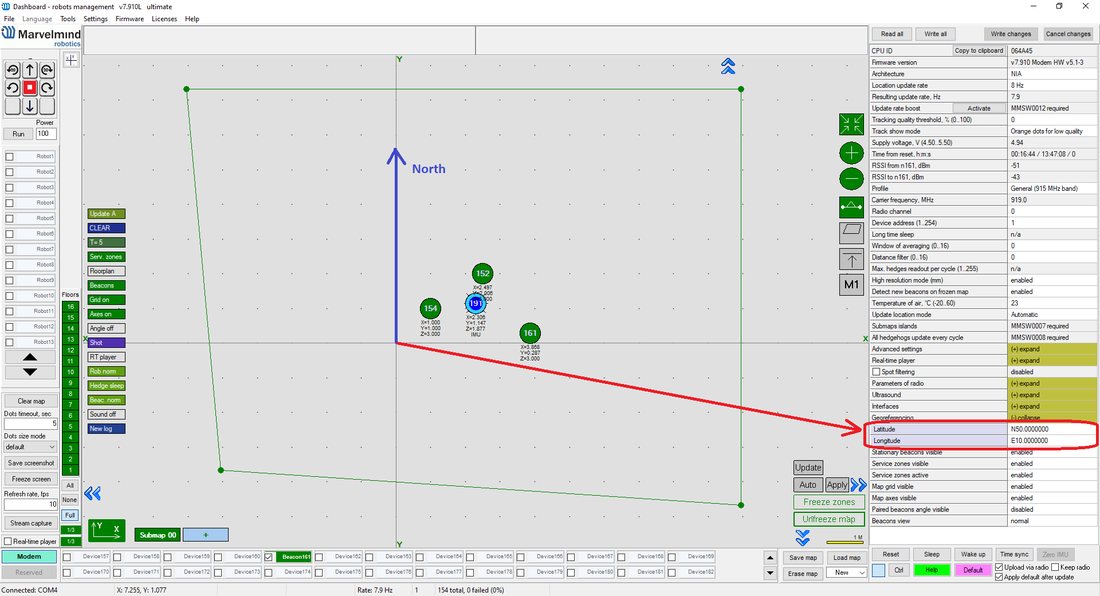
Figure 3. Correct implementation of showing to the North
You can specify your geographic location by setting georeferencing in modem settings, as shown in the screenshot below.

The same as with modem
The same as with modem
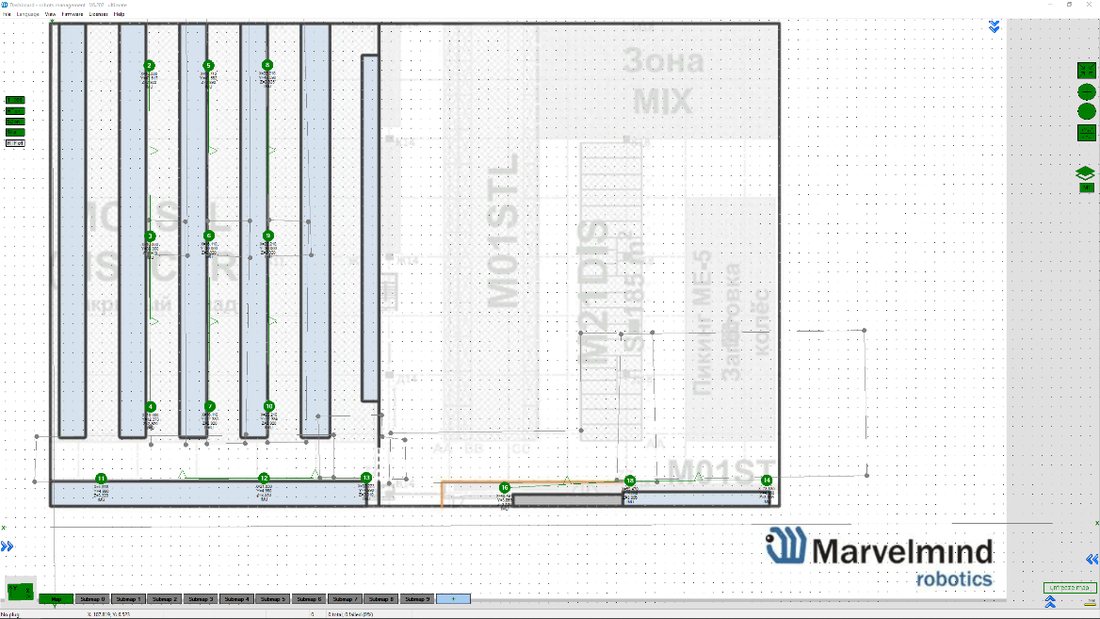
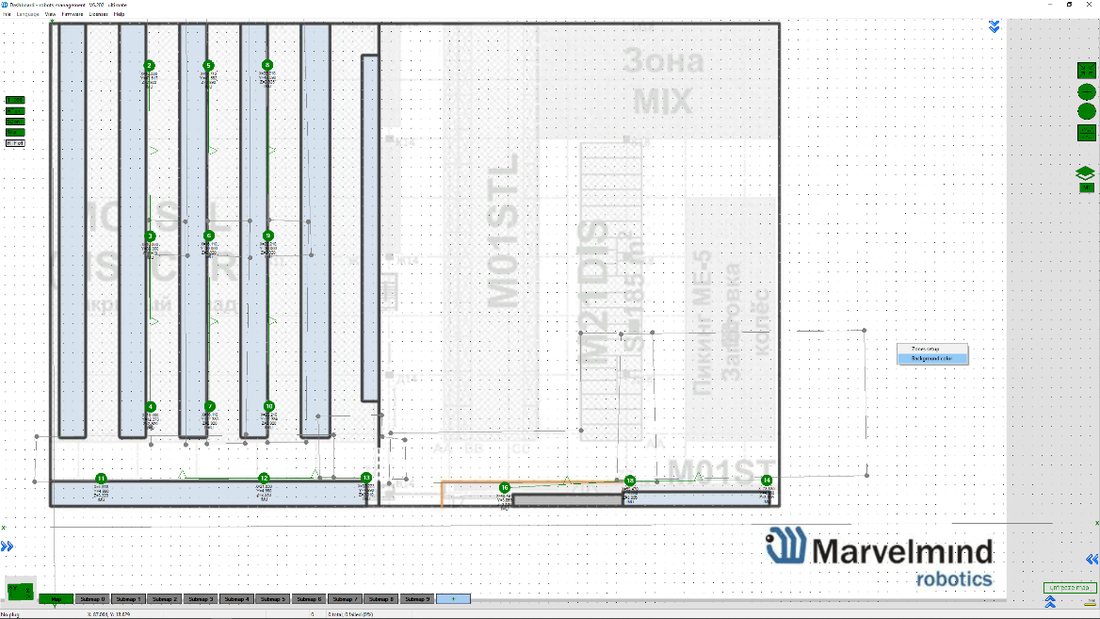
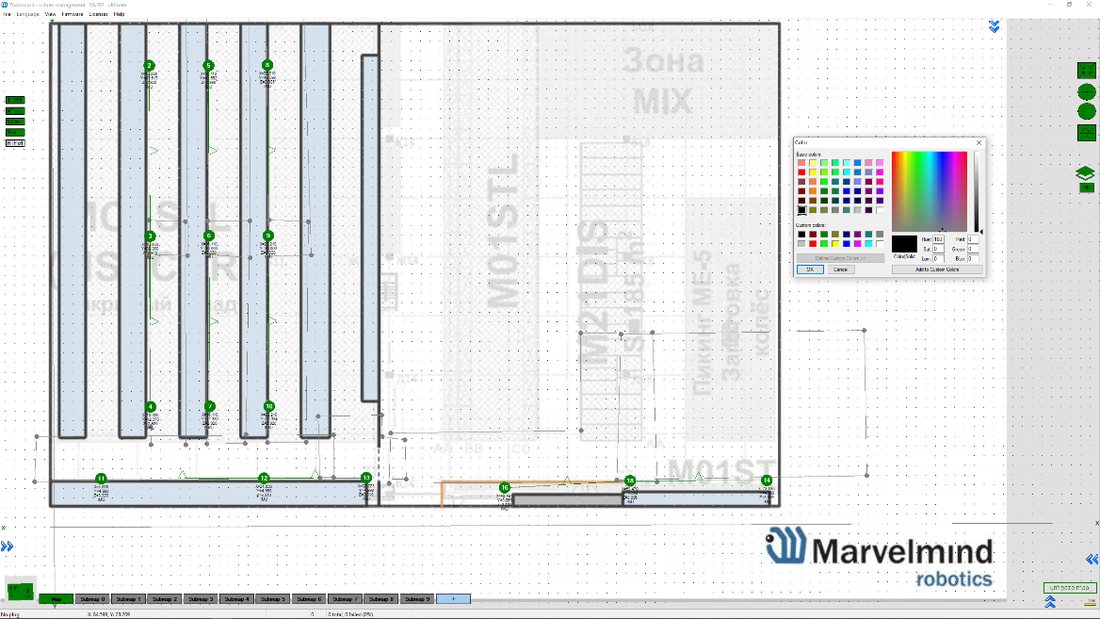
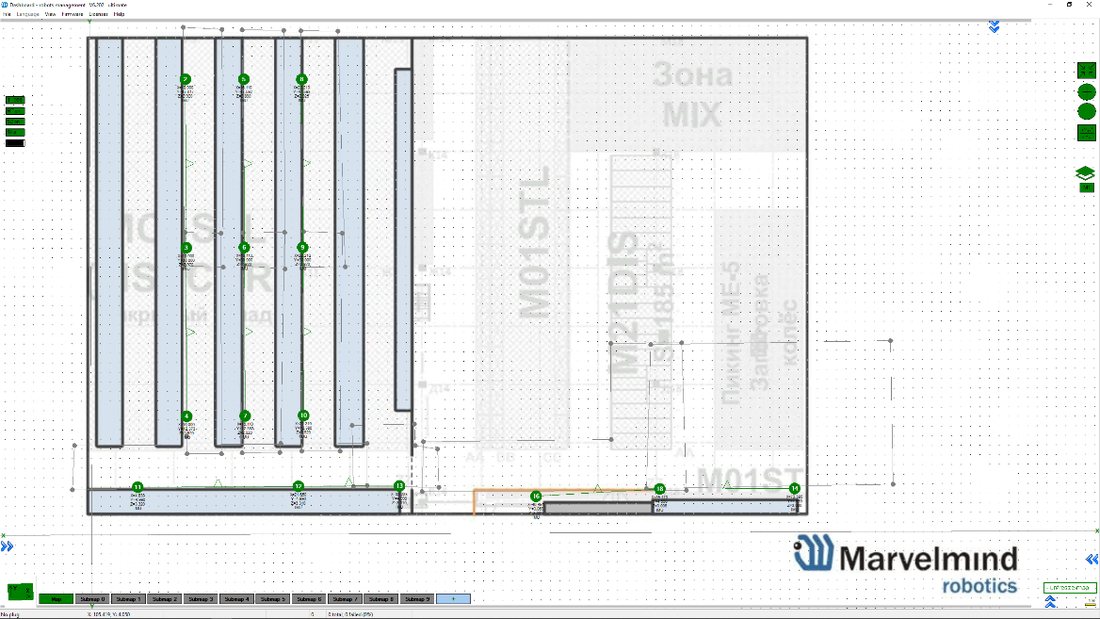
Background Color
Starting from v6.200 Dashboard supports background color change.
This is a small feature that helps make tracking look better. If you uploaded a floor plan that is white, you can tune the Dashboard’s background color to match.
How to choose background color:
- Load floorplan
- Right click on the background
- Choose color and press “OK”
- Color applied. Now, background matches floorplan
Hedge Color Change
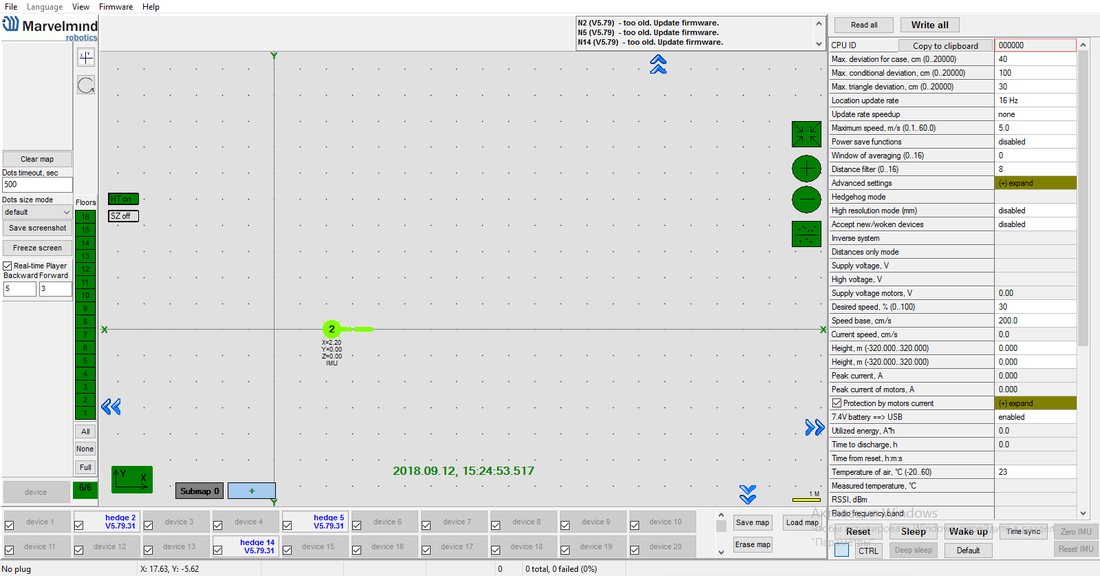 If you have multiple mobile beacons, you can give each one its own color to make it recognizable on the map
How to change hedgehog color:
 Right click on the hedge in the list of devices -> Setup color
- Choose any color which suits you and press OK
- Now, the hedgehog and its tracking path will be colored
Payload Streaming
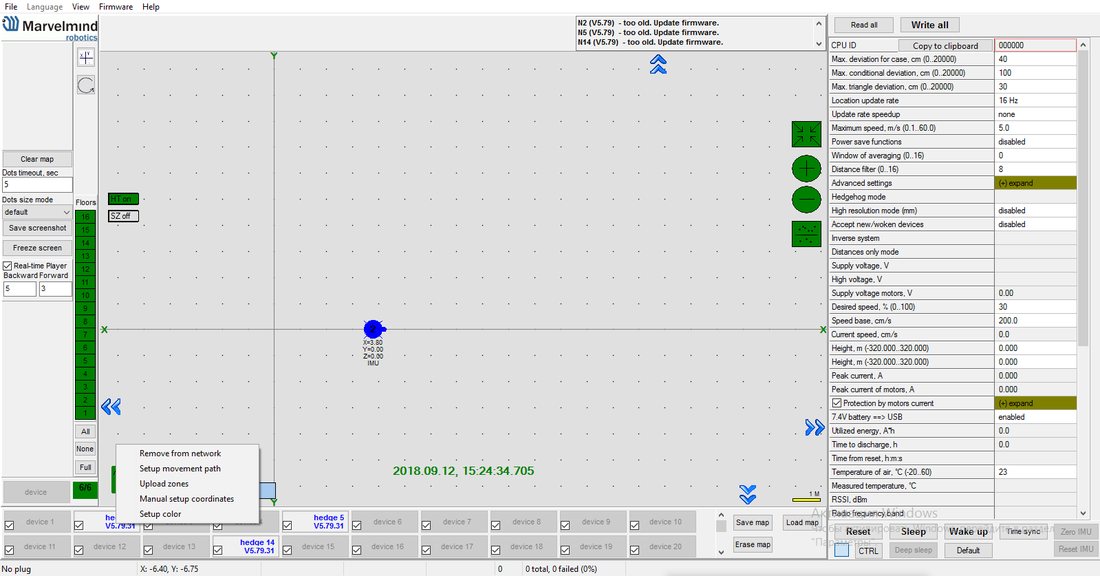 Right click on the hedge in the list of devices -> Setup color
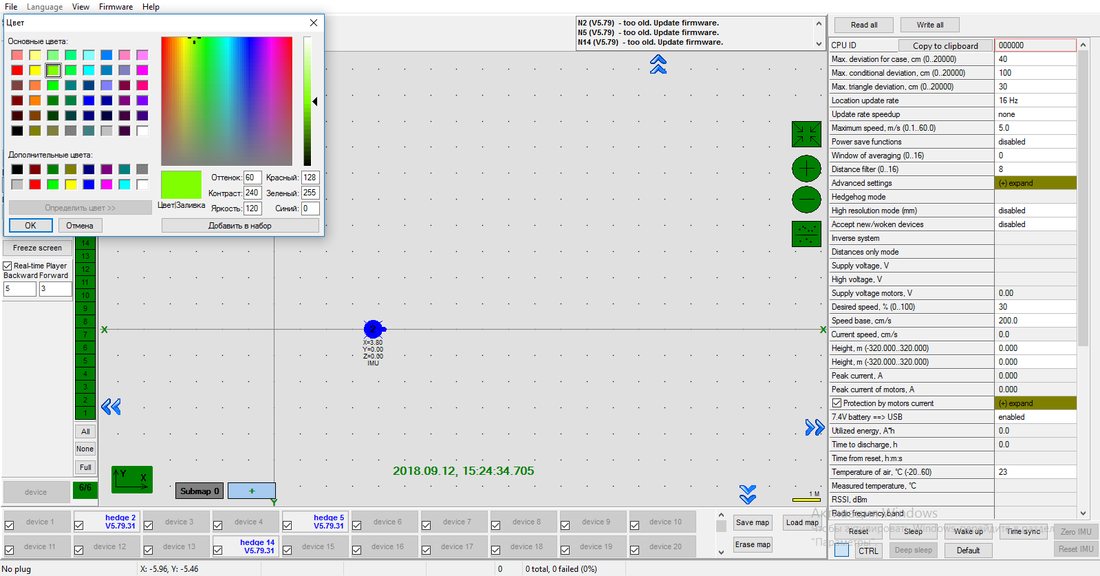 Choose any color which suits you and press OK
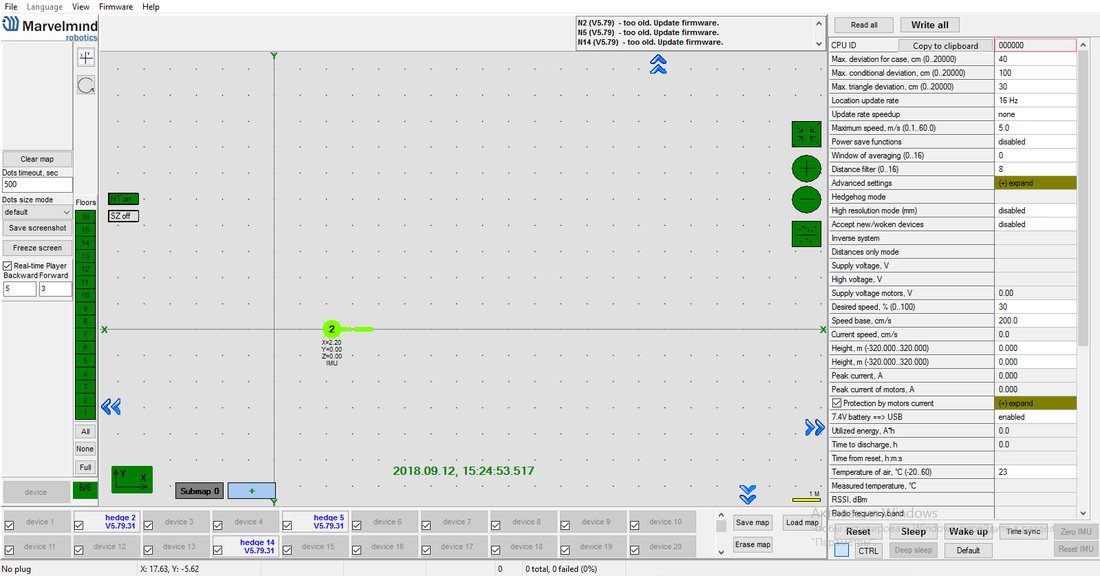 Now, the hedgehog and its tracking path will be colored
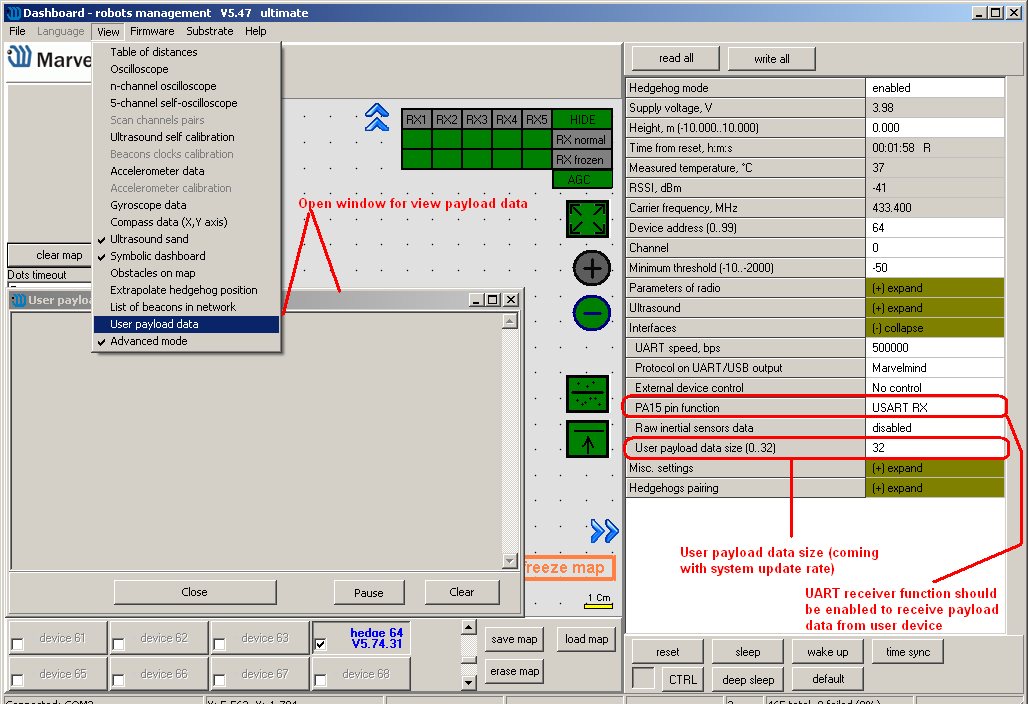
Mobile beacon streaming user payload to modem. See the table with speed vs payload.
- All measurements were made with an update rate setting 16 Hz. Distance, radio profile, and payload data size limit the real update rate
- Additionally, with the MMSW0005 license, the hedgehog payload is recorded in CSV format
System configuration | Radio profile, kbps | User payload data per cycle, bytes | Real update rate, Hz | User payload maximum data rate (bytes per second) |
2 stationary beacons, 3 meters maximum distance | 500 (FEC) | 0 | 16 | 0 |
32 | 16 | 512 | ||
153 (FEC) | 0 | 16 | 0 | |
32 | 16 | 512 | ||
38.4 (FEC) | 0 | 9 | 0 | |
32 | 8 | 256 | ||
38.4 (no FEC) | 0 | 14 | 0 | |
32 | 13 | 416 | ||
4 stationary beacons, 11 meters distance | 500 (FEC) | 0 | 14 | 0 |
32 | 14 | 448 | ||
153 (FEC) | 0 | 12 | 0 | |
32 | 12 | 384 | ||
38.4 (FEC) | 0 | 6 | 0 | |
32 | 6 | 192 | ||
38.4 (no FEC) | 0 | 9 | 0 | |
32 | 9 | 288 |
IMU Feature
This function allows to increase data update rate received from ultrasound beacon with IMU due to sensor fusion up to 100 Hz, using inertial sensors (accelerometer, gyroscope).
Setup IMU Feature
Accelerometer calibration
Required:
- Starter set
- Hedgehog with IMU
- SW and firmware version 5.85 or newer
- Ultrasound Update rate 4 Hz or higher
Before you start using the feature, check whether the accelerometer has been calibrated
- Check if the hedge was not calibrated before. Was damaged or fell down
- Put the hedgehog on a flat surface (antenna directs up) and connect to your PC. Run the Dashboard
- Go to view => Accelerometer calibration in the open window, click autofill, and clear the table.
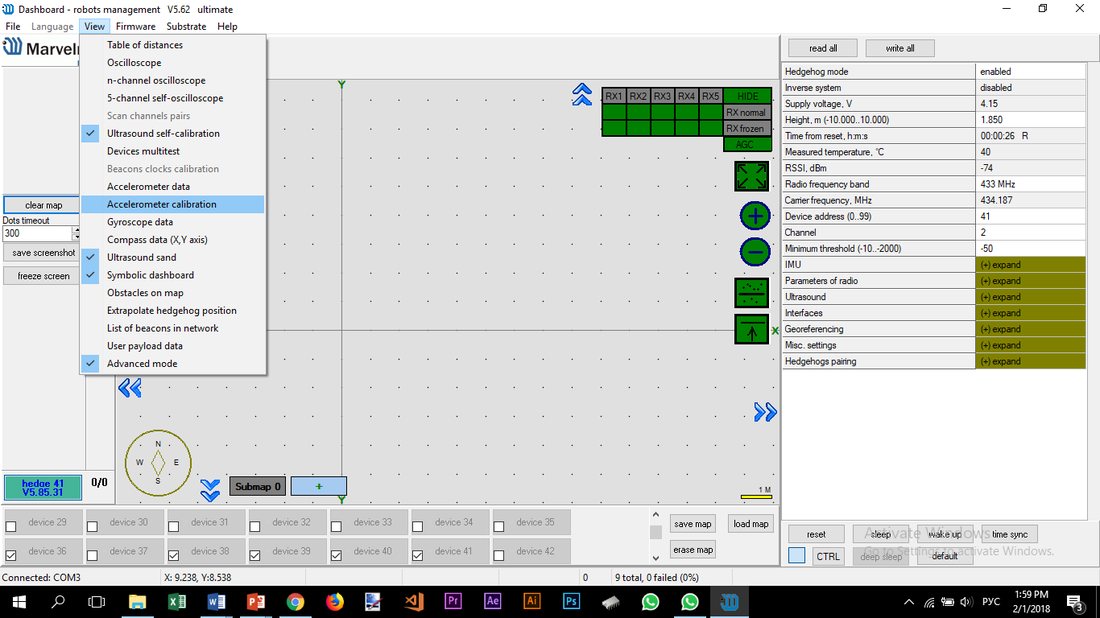

 After all values will refresh. Next, click Pause (shift + space)
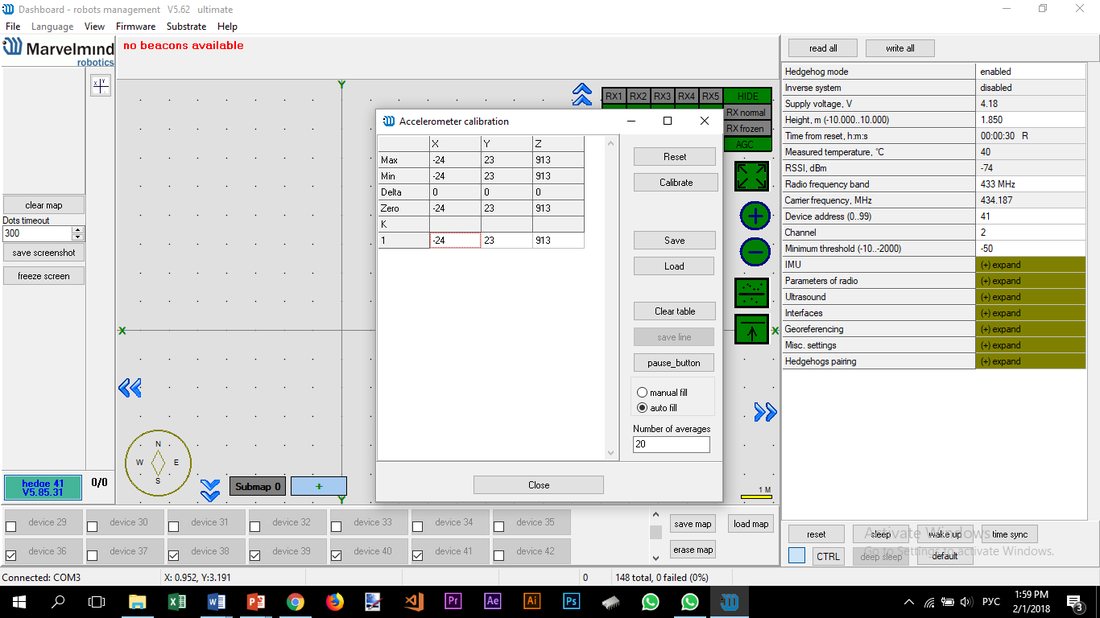 After all values will refresh. Next, click Pause (shift + space)
Then take the beacon (hedgehog) and tilt it to each side towards the ground (about 6 times). Rotate a little. You need to achieve x y z values:
- When antenna directs down z ≈ – 1000 => antenna directs up z ≈ 1000
- So, one of the axis values always will be – + 1000. Others ⩽ 10 (preferably less than 10, but 25 is also permissible)
- Every time before calibrating the hedgehog click Pause
- The accelerometer calibrator will choose the best value for each axe. At the end, click Calibrate and close the window
- Calibration is needed to determine the g value for each accelerometer axe
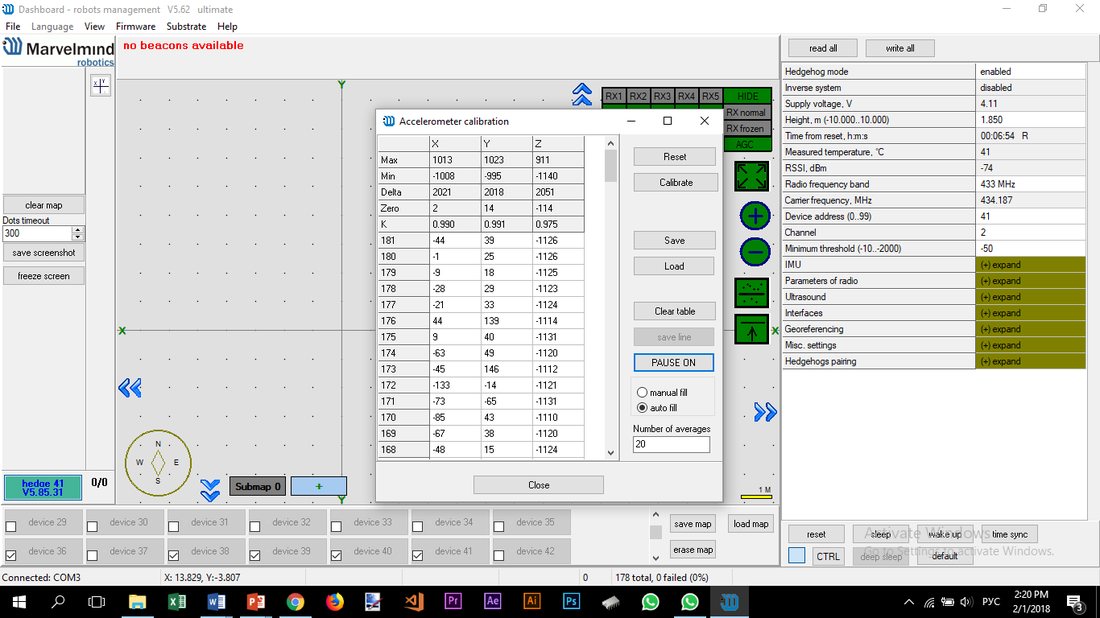 Calibration is needed to determine the g value for each accelerometer axe
 Start the system:
Set up the system as usual. It is described in the paragraph Setting up the system.
After the ultrasound tracking has started, select the hedgehog in the Dashboard, go to the menu Interfaces (on the right), and enable Processed IMU data. After that, it is recommended to bring the hedgehog to real estate and press the ZERO IMU button (right-bottom) for additional sub-calibration of the gyro. After 5 seconds, the hedgehog will begin streaming the processed IMU data.
You can also enable Raw inertial sensors mode: streams raw accelerometer and gyroscope data at up to 100 Hz via USB/UART directly from the hedgehog.
Alternatively, enable IMU via modem: streams IMU data via the modem – received via USB/UART connected to the modem and also logged in the Dashboard.
Using Data in the Python Library Example
To work with data, you must use a ready-made library or develop software tools that work with the described protocol.
You can find examples in our software package.
Our company provides ready-made libraries for working with IMU in the following languages:
- python
- c ++
- java
 An example with 3D imaging of a path on IMU with a frequency of 100 Hz in real time, here: marvelmind-imu-tracker.zip
IMU Axis Positioning
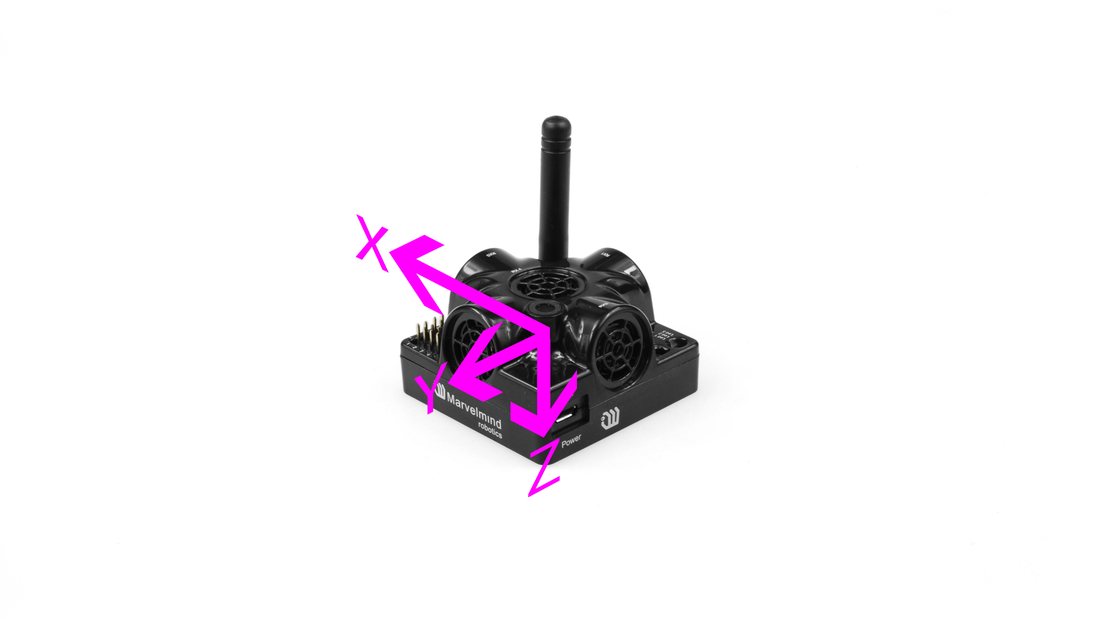
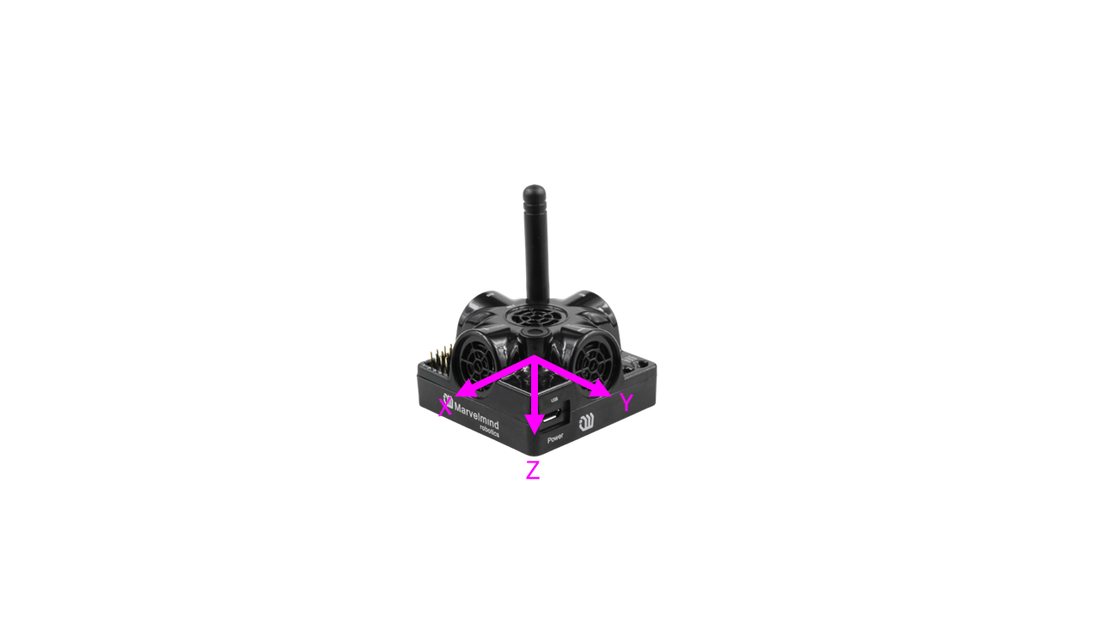 Super-Beacon 1, 2, 3 IMU axis positions
Super-Beacon 4 IMU axis positions
HW v4.9 IMU axis positions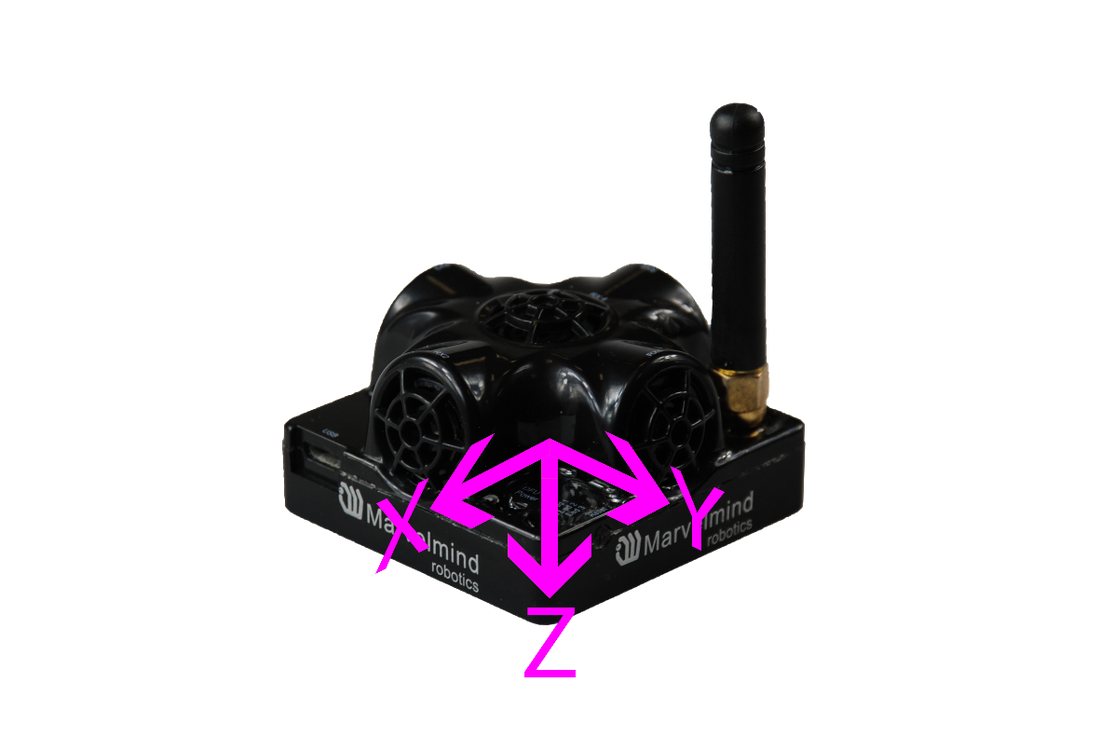
Mini-TX IMU axis positions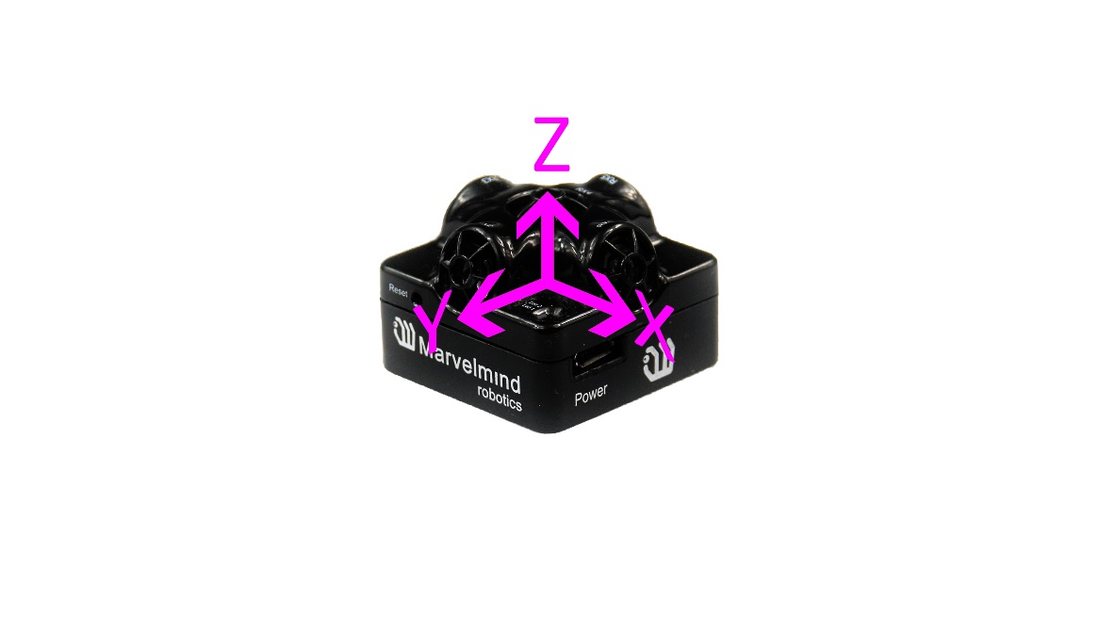
Mini-RX beacon IMU axis positions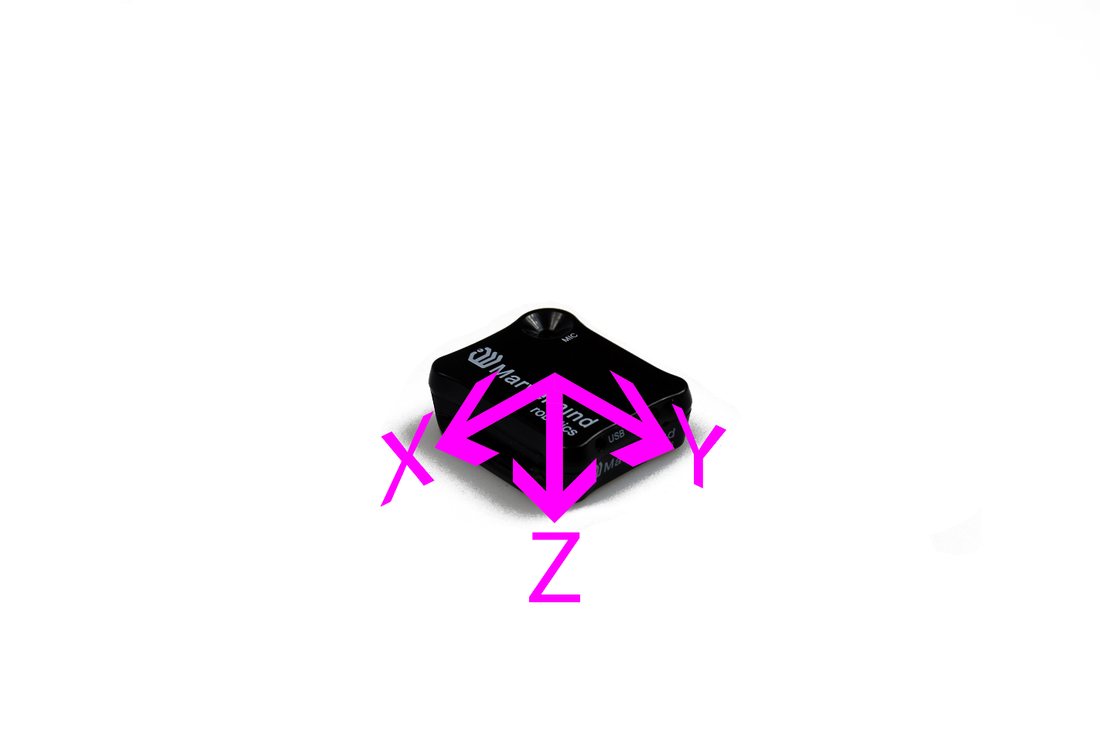
Player Feature
This function is used to view the distance passed, the copter’s flight, etc. The player displays statistics on the maximum and average speed and the path traveled.
Starting with Dashboard v6.240, log files are written in .csv format
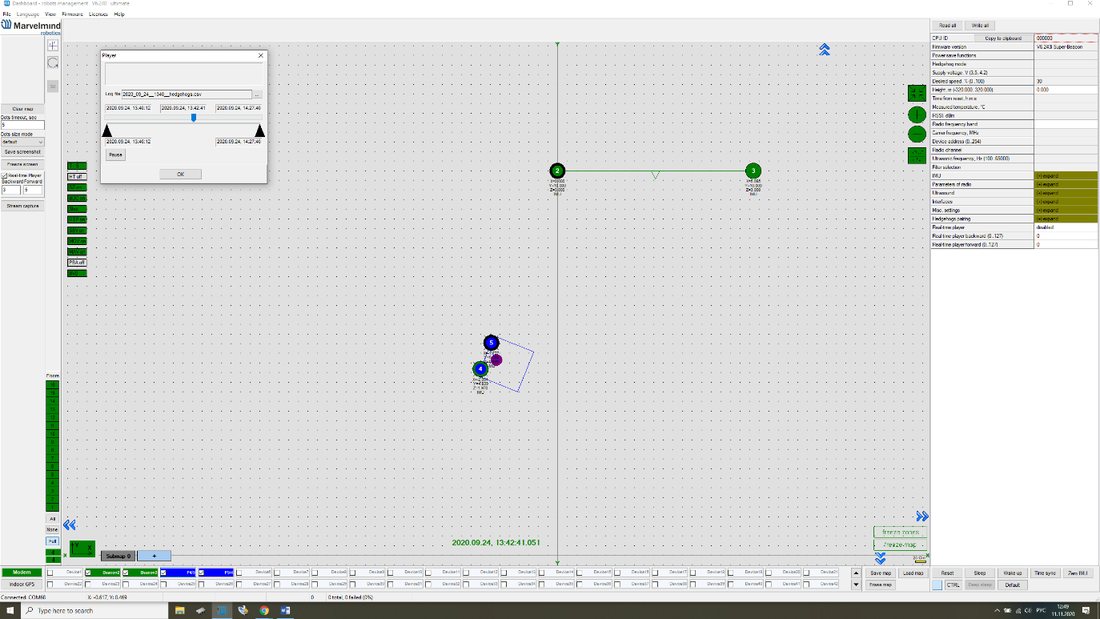
How to use Player:
- Go to File=>Player
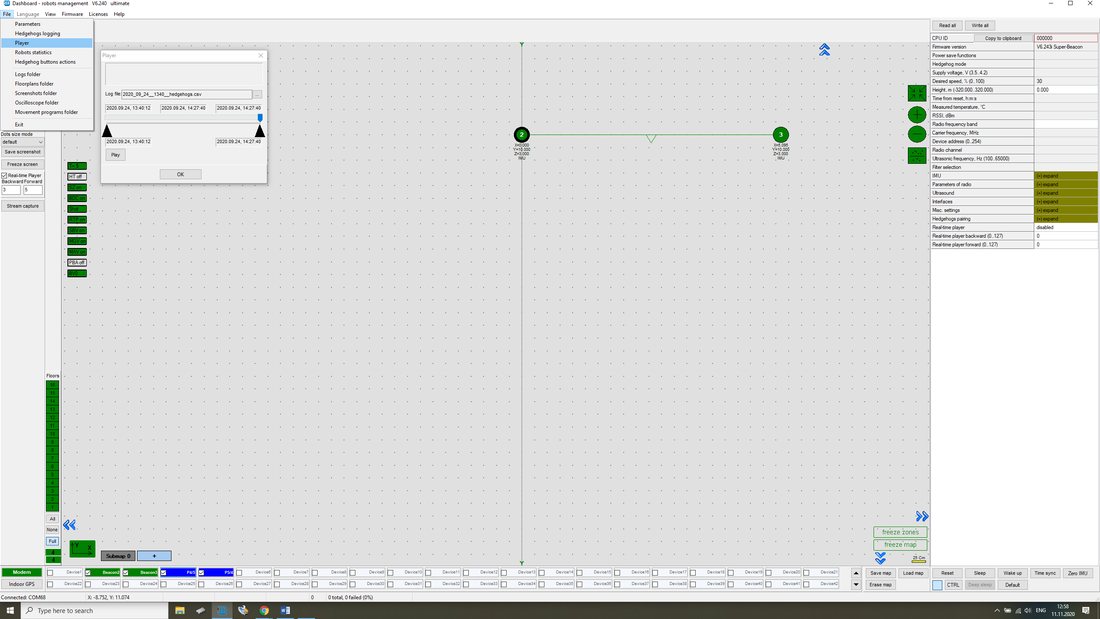
This is how the starting player menu looks like
Select log – opens a saved log file
Play – launch the playback
- Click the Select log button and choose the file
- Now the log is loaded. Important: To record the log file, click Save map to save all the beacons’ locations and attach all the beacons to the log. The log file was also created while Freeze map pressing.
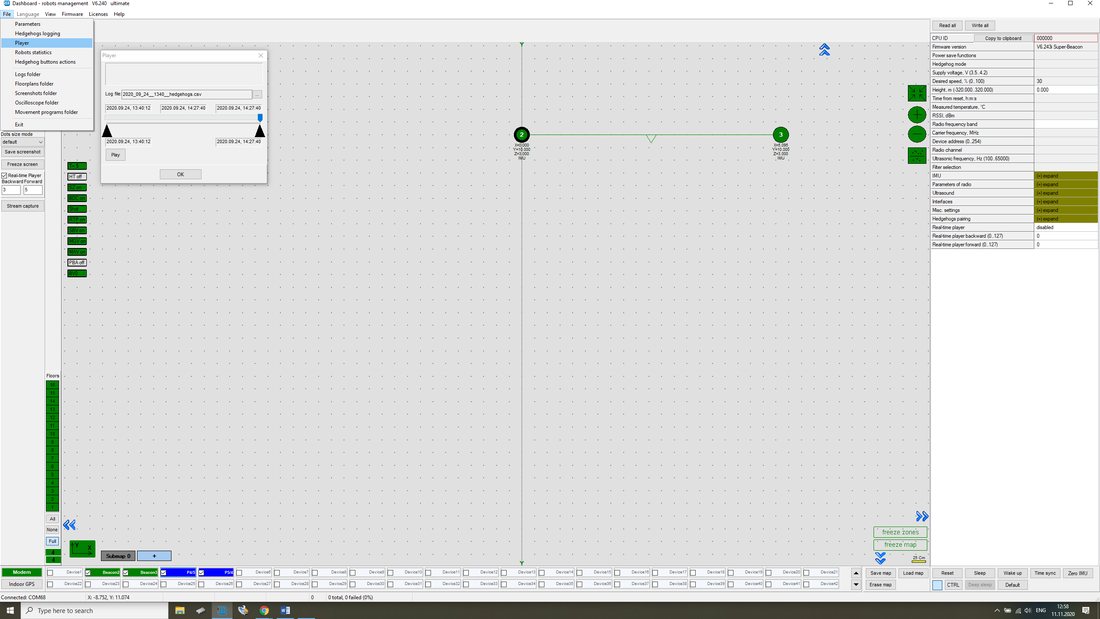
- Start of Log time
- Currently playing time
- End of Log time
- Start of Playback
- End of Playback
- Play/pause button
- Close player button
- Select log file
Limited area – the distance between black triangles under the slider. You can move triangles, zoom, and place the cursor on the slider + mouse wheel. Triangles limit the area in which the player works, and the statistics are calculated
Absolute Distance Calibration
In case of frequent temperature changes, sometimes absolute calibration is a helpful tool to provide accurate tracking.
There are two types of absolute calibration:
- One is based on a reference points-the known absolute coordinates of some points
- Another is based on the submap-the user knows the absolute distance between beacons in the submap
The next two chapters explain these methods in detail, including the instructions.
Absolute Distance Calibration Based on a Reference Points
The user places the mobile beacons at reference points and applies calibration to force the system to correct the location measurement so that the reported location corresponds to absolute values.
It is very important to use as many points as possible for calibration (ex. 4 points in the corners of a submap + 1 in the center). This will provide more accurate and better tracking.
Below are instructions on how to get absolute distance calibration based on a reference points:
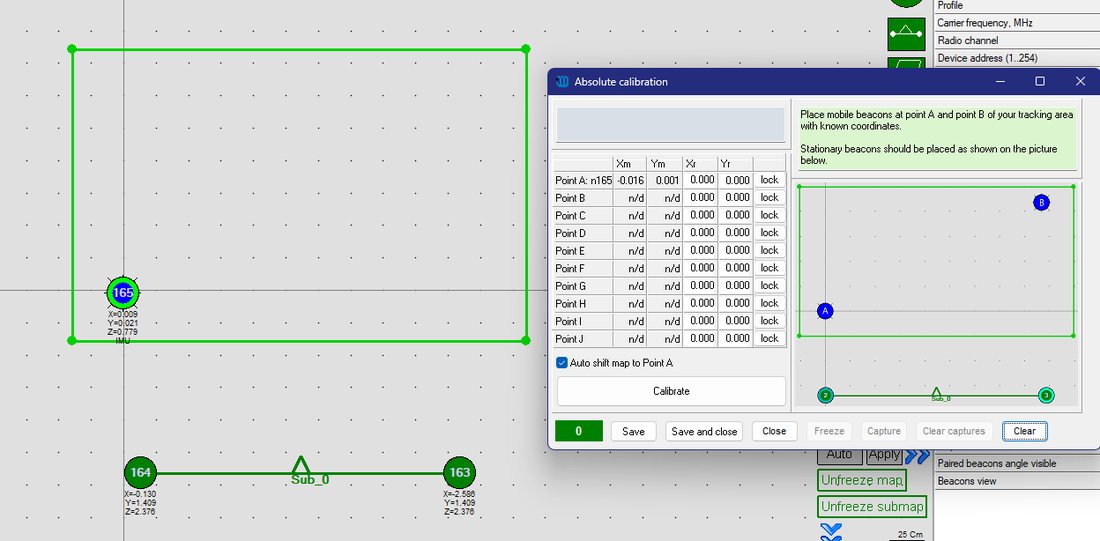 Open Tools -> Absolute calibration
Enter coordinates for a first point (the initial point where the beacon currently is) and press the “lock” button
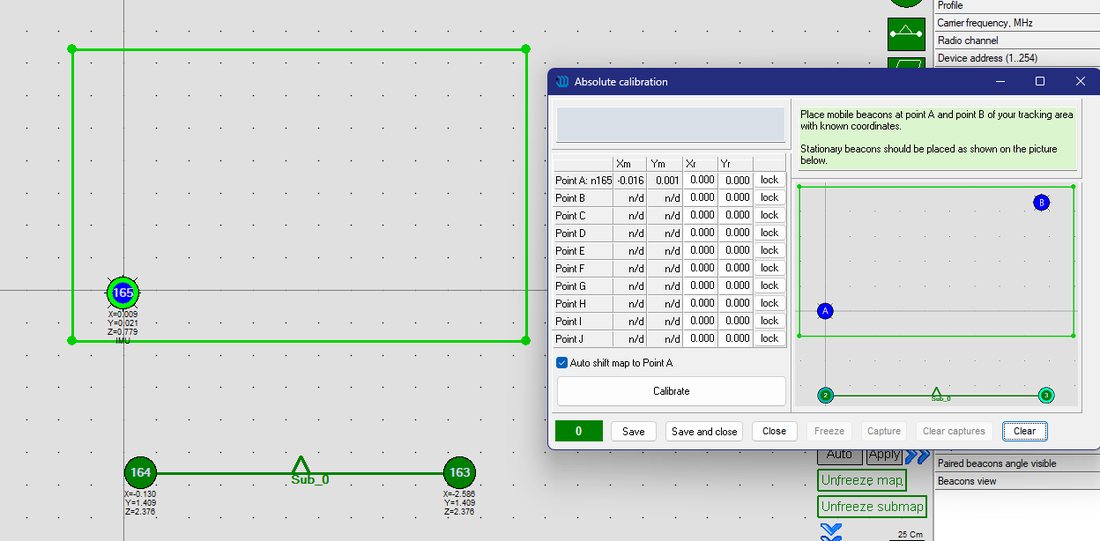
Move the hedgehog to the second point, enter its coordinates, and press the “lock” button
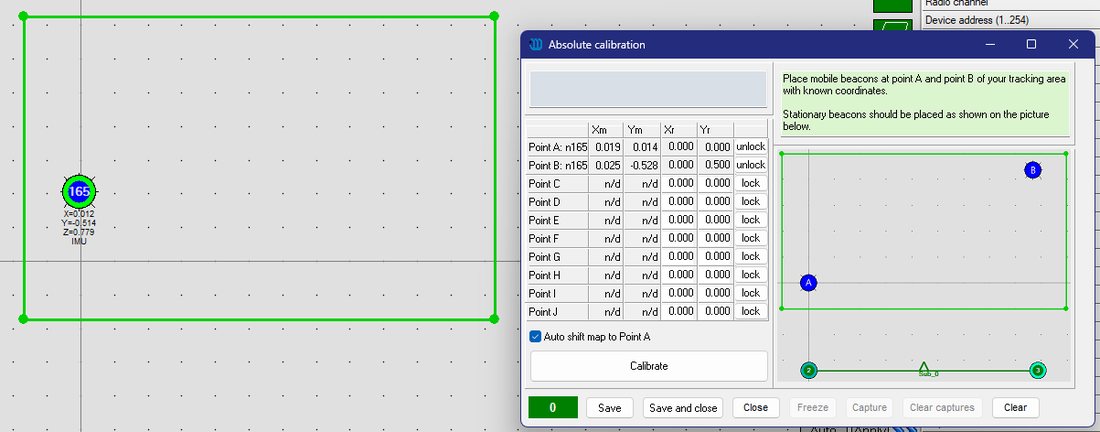
After two points, you can press the “Calibrate” button
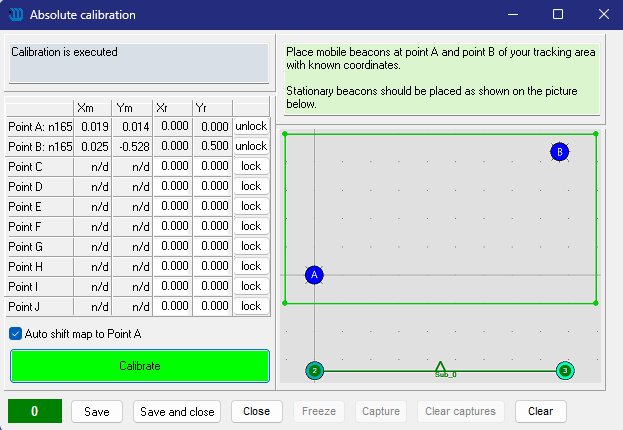
 The absolute distance calibration file will be loaded to the modem
Note that the more points there are, the more accurate tracking will be.
Real-Time Player Feature
The real-time player is a feature that smooths the tracking path. As it looks backward and forward, it has a specific latency based on the selected parameters.
Real-time player has two layers, RTP_1 and RTP_2. For more accurate smoothness, RTP_2 can be enabled.
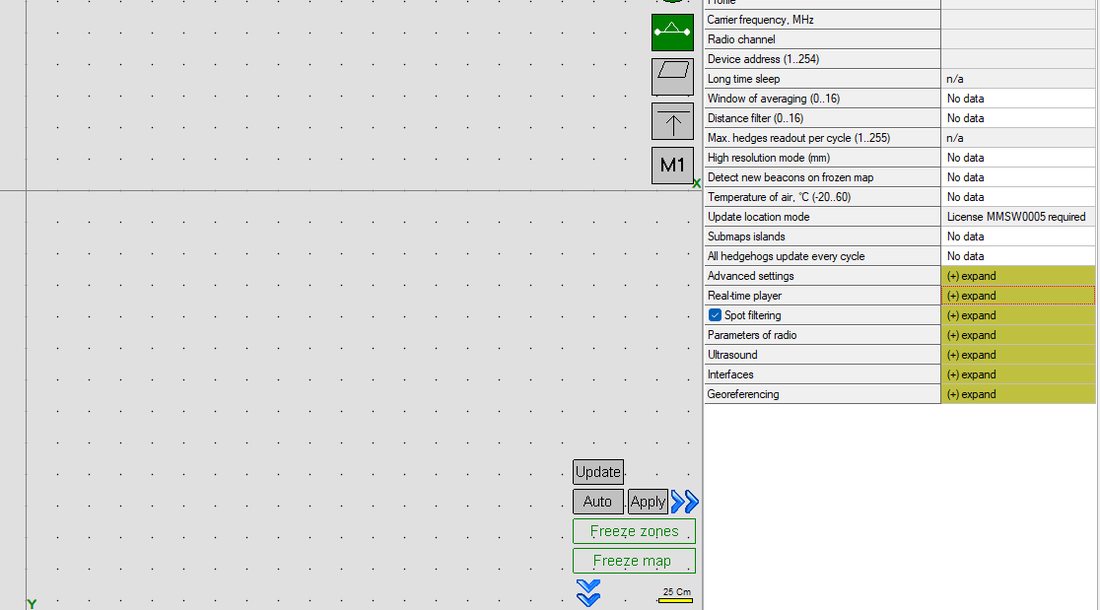
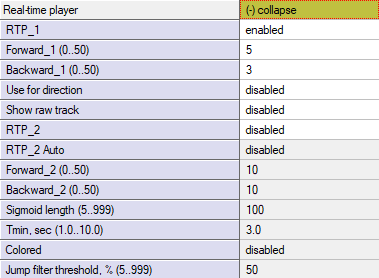
Enables Real-time player 1
Amount of dots which player ‘looks’ forward to provide smooth tracking
Amount of dots which player ‘looks’ forward to provide smooth tracking
Amount of dots which player ‘looks’ backward to provide smooth tracking
Amount of dots which player ‘looks’ backward to provide smooth tracking
Enables Real-time player 2
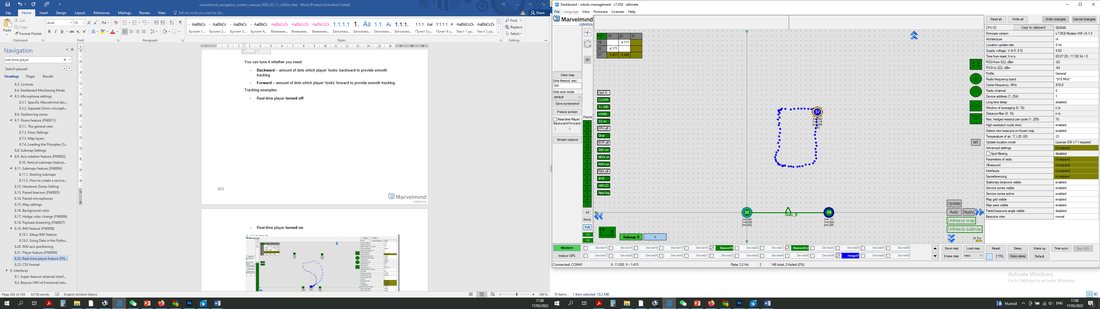
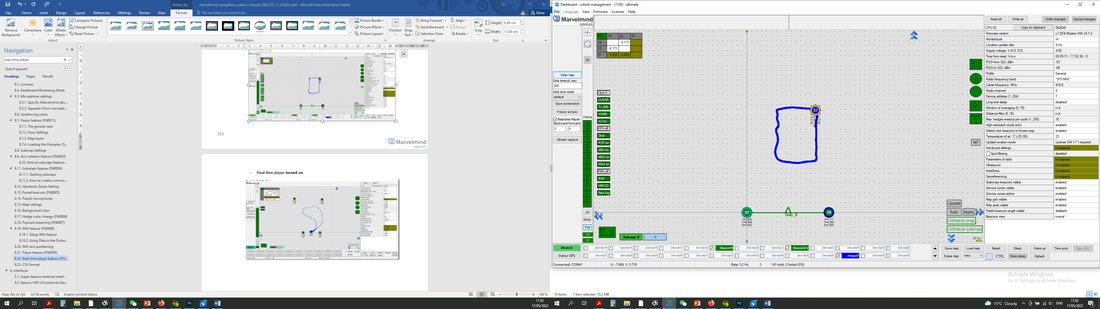
Tracking examples:
- Real-time player turned off
- Real-time player turned on
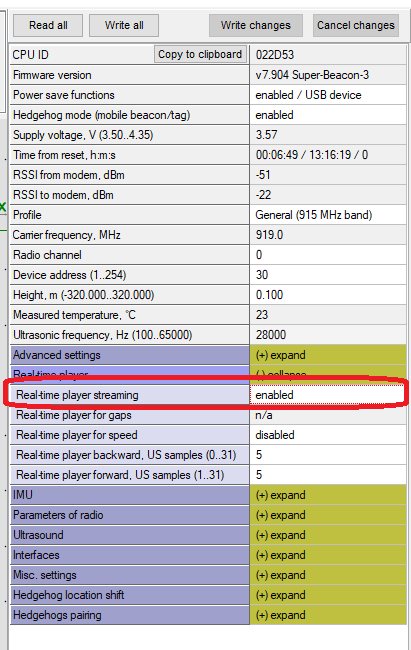 Real-time player can also be enabled on a mobile beacon. It is equivalent to RTP_1 and applied to data streamed via UART and USB.
CSV Format
In the CSV log file for dashboard versions V7.000+, each event is recorded as one CSV line and different events correspond to different line formats. At the same time, the line’s starting is equal for all line types.
Here is an example of several lines from the CSV log file:
T2021_11_04__173001_581,user,41,17,14,4.675,2.714,0.250,2,975,100
T2021_11_04__173001_581,user,41,17,15,4.665,2.708,0.250,2,975,114
T2021_11_04__173001_581,user,41,17,26,4.073,1.987,0.250,2,3462,128
T2021_11_04__173001_581,user,41,17,27,4.075,1.987,0.250,2,3462,141
T2021_11_04__173001_581,user,41,17,28,3.588,1.979,0.250,2,3496,155
T2021_11_04__173001_581,user,41,17,29,3.592,1.978,0.250,2,3496,169
T2021_11_04__173001_701,user,43,15,nl
T2021_11_04__173001_728,user,43,27,nl
T2021_11_04__173001_756,user,43,29,nl
Standard part of the line includes the first 3 fields:
“T2021_11_04__173001_581” – timestamp for data from this line: 2021.11.04, 17:30:01.581.
“user”-username (reserved for future_. The dashboard will support logging in users in future versions.
“41” – ID of the line type. Different line types have different formats in the following fields.
There are some common special codes in data fields:
“nl” – no license. Some license is required to fill out this field.
“na” – not applicable. There is no relevant data for this field. For example, the X, Y, and Z coordinates fields will contain “na” if the mobile beacon is not successfully located.
For more information, see Chapter 9 in our Marvelmind Interfaces manual.